Choosing the right statistical test for your dissertation can feel confusing when you are new to data analysis. You may have research questions, a dataset, and SPSS installed, but still wonder whether to use a t-test, ANOVA, chi-square test, correlation, or regression.
The best way to choose a statistical test is not to start with the test name. Start with your research question. Then look at your variables, the number of groups, the study design, and the assumptions of the test.
This guide will walk you through the process step by step. It is written for dissertation and thesis students who want a clear, beginner-friendly way to match their research questions to the correct statistical test.
By the end, you should understand how to choose the right statistical test for your dissertation and how to justify that choice in your methodology or results chapter.
Step 1: Start With Your Research Question
Your research question should guide your statistical test. Do not choose a test just because it is common, advanced, or easy to run in SPSS.
First, ask yourself what your research question is trying to do.
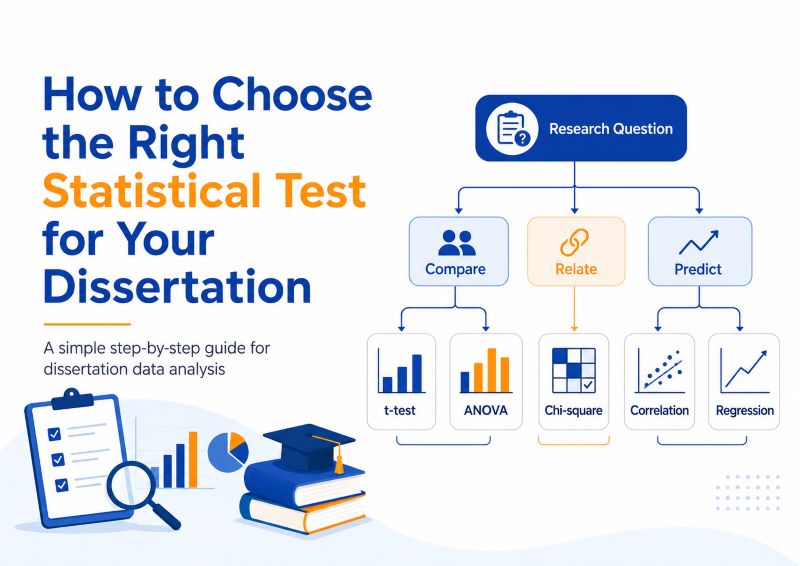
Most dissertation research questions fall into one of four categories:
- Describe one or more variables
- Compare groups or conditions
- Examine relationships between variables
- Predict an outcome
For example, if your question asks about the average level of stress among students, you are describing a variable. If it asks whether stress differs between male and female students, you are comparing groups.
If your question asks whether stress is related to academic performance, you are examining a relationship. If it asks whether stress predicts academic performance, you are doing a prediction.
Once you know the purpose of the research question, the list of possible tests becomes much smaller.
If you need help turning research questions into an analysis plan, our dissertation data analysis help service can support you from research questions to results interpretation.
Step 2: Identify the Dependent Variable
The dependent variable is the outcome variable. It is the variable you want to explain, compare, measure, or predict.
In many dissertation studies, the dependent variable is the main result of interest. It may be a test score, anxiety score, customer satisfaction score, recovery status, academic performance, or employee productivity.
Consider this research question:
“Is there a difference in anxiety scores between students who receive counseling and students who do not?”
The dependent variable is the anxiety score because it is the outcome being compared.
Now consider this question:
“Do study hours, attendance, and motivation predict GPA?”
The dependent variable is GPA because it is the outcome being predicted.
You must identify the dependent variable before choosing the test because many tests depend on the type of outcome variable you have.
For example, linear regression works well when the outcome is continuous. Logistic regression is better when the outcome is binary, such as yes/no or pass/fail.
Step 3: Identify the Independent Variable or Predictor
The independent variable is the variable used to explain, group, compare, or predict the dependent variable.
In group comparison studies, the independent variable is often the grouping variable. For example, gender, treatment group, education level, or teaching method may be independent variables.
In prediction studies, the independent variables are usually called predictors. These may include age, income, study hours, job stress, motivation, or social support.
Consider this research question:
“Do employees in three departments differ in job satisfaction?”
The dependent variable is job satisfaction. The independent variable is department because it defines the groups being compared.
Now consider this question:
“Does job stress predict employee burnout?”
The dependent variable is burnout. The independent variable is job stress because it is the predictor.
This step matters because some tests compare groups, while others examine relationships or prediction. You cannot choose the correct test if you are not clear about the role of each variable.
Step 4: Check the Level of Measurement
After identifying your variables, check their level of measurement. This is one of the most important steps in choosing the right statistical test.
A continuous variable is numeric and can be meaningfully averaged. Examples include age, income, exam score, GPA, depression score, stress score, and satisfaction scale score.
A categorical variable places cases into groups. Examples include gender, marital status, department, treatment group, employment status, and learning mode.
A binary variable has only two categories. Examples include yes/no, pass/fail, completed/not completed, and purchased/not purchased.
An ordinal variable has categories with a clear order. Examples include low, medium, high or strongly disagree to strongly agree.
Your test depends heavily on the dependent variable. If the outcome is continuous, you may use a t-test, ANOVA, correlation, or linear regression. If the outcome is categorical, you may need a chi-square test or logistic regression.
Are you using SPSS and need to prepare variables before analysis? Read our guide on how to recode variables in SPSS.
Step 5: Decide Whether You Are Describing, Comparing, Relating, or Predicting
At this stage, combine your research question and variable types. Ask what you want to do with the variables.
If you only want to summarize your sample or describe a variable, use descriptive statistics. These include frequencies, percentages, means, medians, and standard deviations.
If you want to compare groups, choose a test that compares means or proportions. Common examples include t-tests, ANOVA, and chi-square tests.
If you want to examine whether two variables are related, choose a correlation or association test. Common examples include Pearson correlation, Spearman correlation, and the chi-square test of independence.
If you want to predict an outcome, choose a regression test. Common examples include linear regression, multiple regression, and logistic regression.
This step helps you avoid a common mistake. Many students choose a test based only on the variable type. However, variable type alone is not enough. You must also consider the purpose of the analysis.
Step 6: Check the Number of Groups or Time Points
If your research question compares groups or measurements, you need to check how many groups or time points are involved.
If you are comparing two independent groups on a continuous outcome, you may need an independent samples t-test.
Example:
“Do male and female students differ in mean academic performance?”
If you are comparing the same participants at two time points, you may need a paired samples t-test.
Example:
“Did anxiety scores change from pretest to posttest?”
If you are comparing three or more independent groups, you may need a one-way ANOVA.
Example:
“Do students from three academic programs differ in mean GPA?”
If you are comparing the same participants across three or more time points, you may need repeated measures ANOVA.
Example:
“Do stress scores change across baseline, midpoint, and final assessment?”
The number of groups or time points is one of the fastest ways to narrow down the correct statistical test.
Step 7: Decide Whether Observations Are Independent or Related
This step is very important in dissertation data analysis. Many students choose the wrong test because they confuse independent and related observations.
Observations are independent when each participant belongs to only one group. For example, a student is either in the treatment group or the control group, not both.
Observations are related when the same participants are measured more than once. They are also related when participants are matched in pairs.
For example, pretest and posttest scores from the same participants are related. Husband-wife pairs, matched patients, or matched schools may also produce related data.
This distinction affects the test you choose.
Use an independent samples t-test when comparing two separate groups. Use a paired samples t-test when comparing two related measurements.
Use one-way ANOVA when comparing three or more independent groups. Use repeated measures ANOVA when comparing three or more related measurements.
If you are unsure whether your groups are independent or related, look at how the data were collected.
Step 8: Check the Assumptions of the Test
Choosing the test is not the final step. You also need to check whether your data meets the assumptions of that test.
Common assumptions include:
- Independence of observations
- Normality
- Homogeneity of variance
- Linearity
- Absence of serious outliers
- Adequate sample size
For example, an independent samples t-test assumes that the outcome is continuous, the groups are independent, and the outcome is approximately normally distributed within groups. It also assumes that variances are reasonably equal, although SPSS provides an option when this assumption is violated.
ANOVA also requires normality and homogeneity of variance. Regression requires linearity, independent errors, and no serious multicollinearity.
Assumptions help protect the accuracy of your conclusions. If assumptions are seriously violated, the results may be misleading.
However, do not panic when assumptions are not perfect. Many dissertation datasets are not perfect. What matters is that you check the assumptions, report them clearly, and choose a suitable alternative when needed.
Step 9: Choose a Nonparametric Alternative If Needed
If your data do not meet the assumptions of a parametric test, you may need a nonparametric alternative.
Nonparametric tests are useful when your data are ordinal, highly skewed, affected by extreme outliers, or unsuitable for a standard parametric test.
For example, if you planned to use an independent samples t-test but your outcome is not suitable for that test, you may consider the Mann-Whitney U test.
If you planned to use a paired samples t-test, you may consider the Wilcoxon signed-rank test.
If you planned to use a one-way ANOVA, you may consider the Kruskal-Wallis test.
If you planned to use repeated measures ANOVA, you may consider the Friedman test.
Here is a simple guide:
| Planned test | Possible alternative |
|---|---|
| Independent samples t-test | Mann-Whitney U test |
| Paired samples t-test | Wilcoxon signed-rank test |
| One-way ANOVA | Kruskal-Wallis test |
| Repeated measures ANOVA | Friedman test |
| Pearson correlation | Spearman correlation |
The alternative test should still match your research question and study design.
When to Use Descriptive Statistics
Use descriptive statistics when your goal is to summarize your data rather than test a hypothesis.
For categorical variables, report frequencies and percentages. For continuous variables, report means, standard deviations, medians, minimums, and maximums.
For example, you may describe your sample by gender, age group, education level, or employment status. You may also report the average age, average income, or average satisfaction score.
Descriptive statistics often appear at the beginning of the results chapter. They help readers understand your sample before you present hypothesis tests.
However, descriptive statistics do not test whether a difference or relationship is statistically significant. They only summarize what is in the data.
For example, you can use descriptive statistics to show that one group has a higher mean score than another group. But you need an inferential test to determine whether that difference is statistically significant.
Most dissertations use descriptive statistics first, then move to inferential tests.
When to Use an Independent Samples T-Test
Use an independent samples t-test when you want to compare two separate groups on one continuous outcome.
Example research question:
“Is there a significant difference in exam scores between students who received tutoring and students who did not?”
In this example, exam score is the continuous dependent variable. Tutoring group is the independent variable with two groups. The groups are independent because each student belongs to only one group.
An independent samples t-test is suitable when:
- The dependent variable is continuous
- The independent variable has two groups
- The groups are independent
- You want to compare mean scores
Common dissertation examples include comparing male and female students, treatment and control groups, online and face-to-face learners, or trained and untrained employees.
If you need SPSS steps, read our guide on how to run an independent samples t-test in SPSS.
When to Use a Paired Samples T-Test
Use a paired samples t-test when you want to compare two related measurements on one continuous outcome.
This test is common in pretest-posttest studies.
Example research question:
“Did students’ anxiety scores decrease after the counseling program?”
In this example, the anxiety score is measured twice for the same students. The first score is collected before counseling. The second score is collected after counseling.
A paired samples t-test is suitable when:
- The dependent variable is continuous
- The same participants are measured twice
- The two measurements are related
- You want to test a change over time or a condition
You may also use this test for matched pairs, such as matched patients or matched schools.
If you need help reporting the result, read our guide on how to report paired samples t-test results in APA.
When to Use One-Way ANOVA
Use one-way ANOVA when you want to compare three or more independent groups on one continuous outcome.
Example research question:
“Do students from low, middle, and high socioeconomic status groups differ in academic achievement?”
In this example, academic achievement is the continuous dependent variable. Socioeconomic status is the independent variable with three groups.
A one-way ANOVA is suitable when:
- The dependent variable is continuous
- The independent variable has three or more groups
- The groups are independent
- You want to compare group means
ANOVA tells you whether at least one group mean differs from another. If the result is statistically significant, you may need a post hoc test to find out which groups differ.
Common post hoc tests include Tukey, Bonferroni, and LSD, depending on your assignment, supervisor, or research design.
For SPSS steps, read our guide on how to run a one-way ANOVA in SPSS.
When to Use Repeated Measures ANOVA
Use repeated measures ANOVA when the same participants are measured three or more times on one continuous outcome.
Example research question:
“Do stress scores differ across baseline, mid-semester, and final exam periods?”
In this example, the same students provide stress scores at three time points. The scores are related because they come from the same participants.
Repeated measures ANOVA is suitable when:
- The dependent variable is continuous
- The same participants are measured three or more times
- The measurements are related
- You want to compare change across time or conditions
This test is common in intervention studies, training studies, repeated surveys, and clinical studies.
Repeated measures ANOVA has assumptions that must be checked. One important assumption is sphericity. If this assumption is violated, SPSS may provide corrections such as Greenhouse-Geisser.
If your data are ordinal or unsuitable for repeated measures ANOVA, the Friedman test may be an alternative.
When to Use Factorial ANOVA
Use factorial ANOVA when you have two or more categorical independent variables and one continuous dependent variable.
A two-way ANOVA is the most common form of factorial ANOVA. It has two independent variables.
Example research question:
“Do teaching method and gender affect exam scores?”
In this example, exam score is the continuous dependent variable. Teaching method and gender are categorical independent variables.
A factorial ANOVA can test:
- The main effect of teaching method
- The main effect of gender
- The interaction between teaching method and gender
The interaction tells you whether the effect of one independent variable depends on the level of another independent variable.
For example, one teaching method may work better for one gender group than another. A simple one-way ANOVA would not test this interaction.
Use factorial ANOVA when your dissertation question includes more than one grouping variable and you want to examine both separate and combined effects.
When to Use ANCOVA
Use ANCOVA when you want to compare group means while controlling for another continuous variable.
Example research question:
“Do intervention and control groups differ in posttest scores after controlling for pretest scores?”
In this example, posttest score is the continuous dependent variable. Group is the independent variable. Pretest score is the covariate.
ANCOVA is useful when you want to adjust for a variable that may influence the outcome.
Common covariates include:
- Pretest score
- Age
- Income
- Baseline health status
- Prior academic performance
ANCOVA is suitable when:
- The dependent variable is continuous
- The main independent variable is categorical
- The covariate is continuous
- You want to compare adjusted group means
This test is common in dissertation studies where groups may differ before the intervention starts.
However, ANCOVA has assumptions. These include linearity between the covariate and outcome and homogeneity of regression slopes. You should check these before interpreting the results.
When to Use a Chi-Square Test of Independence
Use a chi-square test of independence when both variables are categorical, and you want to test whether they are associated.
Example research question:
“Is gender associated with preferred learning mode?”
In this example, gender is categorical. Preferred learning mode is also categorical. The test checks whether the preferred learning mode differs by gender.
A chi-square test of independence is suitable when:
- Both variables are categorical
- You have frequency counts
- Observations are independent
- You want to test the association between categories
This test does not compare means. It compares observed counts with expected counts.
Common dissertation examples include testing whether employment status is associated with education level, whether treatment group is associated with recovery status, or whether gender is associated with product preference.
If you need help presenting the result, read our guide on how to report chi-square test results in APA.
When to Use a Chi-Square Goodness-of-Fit Test
Use a chi-square goodness-of-fit test when you have one categorical variable and want to compare observed counts with expected counts.
Example research question:
“Are students equally distributed across four preferred learning styles?”
In this example, there is one categorical variable: preferred learning style. The test checks whether the observed distribution differs from the expected distribution.
A chi-square goodness-of-fit test is suitable when:
- You have one categorical variable
- You have count data
- You have expected proportions or frequencies
- You want to test whether the observed pattern differs from expectation
For example, you may expect equal numbers of students in each category. You may also expect a certain distribution based on theory or previous research.
This test is different from the chi-square test of independence. The goodness-of-fit test uses one categorical variable. The test of independence uses two categorical variables.
For SPSS steps, read our guide on how to run a chi-square goodness-of-fit test in SPSS.
When to Use Pearson Correlation
Use Pearson correlation when you want to examine the relationship between two continuous variables.
Example research question:
“Is there a relationship between study hours and exam scores?”
In this example, both study hours and exam scores are continuous variables. Pearson correlation measures the strength and direction of the linear relationship between them.
A Pearson correlation is suitable when:
- Both variables are continuous
- The relationship is approximately linear
- There are no serious outliers
- The data are reasonably suitable for a parametric test
The result is usually reported as a correlation coefficient, called r. A positive value means the variables tend to increase together. A negative value means one variable tends to decrease as the other increases.
Correlation does not prove causation. If study hours and exam scores are correlated, you cannot automatically say that study hours caused higher scores.
In dissertation writing, you should interpret correlation carefully and avoid causal language unless your design supports it.
When to Use Spearman Correlation
Use Spearman correlation when your variables are ordinal, ranked, non-normal, or not suitable for Pearson correlation.
Example research question:
“Is there a relationship between satisfaction rank and service quality rank?”
Spearman correlation is useful when you want to test whether two variables move together in a consistent order. The relationship does not need to be perfectly linear.
Spearman correlation is suitable when:
- Variables are ordinal
- Data are ranked
- Continuous variables are not normally distributed
- Outliers make Pearson correlation unsuitable
This test is often useful when working with single Likert-type items. For example, one item may measure satisfaction from strongly disagree to strongly agree.
However, if you combine several Likert items into a reliable scale, your supervisor may allow you to treat the total score as continuous. In that case, Pearson correlation may be acceptable.
The best choice depends on your measurement approach, assumptions, and dissertation requirements.
When to Use Linear Regression
Use linear regression when you want to predict a continuous outcome from one or more predictors.
Example research question:
“Do study hours, attendance, and motivation predict GPA?”
In this example, GPA is the continuous dependent variable. Study hours, attendance, and motivation are predictors.
Linear regression is suitable when:
- The dependent variable is continuous
- You have one or more predictors
- You want to predict or explain the outcome
- The relationship is reasonably linear
Simple linear regression uses one predictor. Multiple linear regression uses two or more predictors.
Regression is common in dissertations because it allows you to test the unique contribution of each predictor while controlling for the others.
For example, you can test whether motivation predicts GPA after accounting for study hours and attendance.
Regression also gives useful statistics such as R-squared, coefficients, p-values, and confidence intervals. These help you explain how well the model fits the data.
When to Use Binary Logistic Regression
Use binary logistic regression when your dependent variable has two categories.
Example research question:
“Do age, income, and education predict whether a customer buys a product?”
The outcome has two categories: buys and does not buy. Since the outcome is binary, standard linear regression is not appropriate.
Binary logistic regression is suitable when:
- The dependent variable is binary
- You have one or more predictors
- You want to predict category membership
- The outcome represents an event or non-event
Common binary outcomes include yes/no, pass/fail, completed/not completed, employed/unemployed, and recovered/not recovered.
In dissertation writing, logistic regression results are often reported using odds ratios, confidence intervals, and p-values.
Make sure you explain the outcome category clearly. For example, state whether the model predicts completion, non-completion, purchase, or non-purchase.
When to Use Multinomial Logistic Regression
Use multinomial logistic regression when your dependent variable has three or more categories that are not ordered.
Example research question:
“Do age, income, and prior experience predict preferred learning mode?”
The outcome may have three categories: online, hybrid, and face-to-face. These categories do not have a natural order.
Multinomial logistic regression is suitable when:
- The dependent variable has three or more categories
- The outcome categories are not ordered
- You have one or more predictors
- You want to predict group membership
This test is useful when the outcome is a choice, category, or membership group.
Examples include preferred learning mode, type of service used, career path, brand preference, or treatment option selected.
Do not use multinomial logistic regression if the outcome categories are clearly ordered. If the categories follow a ranking, ordinal logistic regression may be more appropriate.
When to Use Ordinal Logistic Regression
Use ordinal logistic regression when your dependent variable has three or more ordered categories.
Example research question:
“Do income, age, and education predict low, moderate, or high satisfaction?”
The outcome has three categories, and they have a clear order. Low comes before moderate, and moderate comes before high.
Ordinal logistic regression is suitable when:
- The dependent variable is ordinal
- The outcome has ordered categories
- You have one or more predictors
- You want to predict movement across ordered levels
This test is common when outcomes are measured as levels, ratings, or ordered categories.
Examples include low, medium, and high risk; poor, fair, good, and excellent performance; or disagree, neutral, and agree.
Ordinal logistic regression uses the order in the outcome variable. Multinomial logistic regression ignores that order. That is why ordinal logistic regression is usually better when the categories are clearly ranked.
Quick Statistical Test Selection Table
Use this table as a quick reference after you understand your research question and variables.
| Research goal | Outcome variable | Study situation | Suggested test |
|---|---|---|---|
| Describe a variable | Continuous or categorical | Summarize data only | Descriptive statistics |
| Compare two independent groups | Continuous | Two separate groups | Independent samples t-test |
| Compare two related scores | Continuous | Same participants twice | Paired samples t-test |
| Compare three or more groups | Continuous | One grouping variable | One-way ANOVA |
| Compare repeated measurements | Continuous | Same participants 3+ times | Repeated measures ANOVA |
| Compare groups with a covariate | Continuous | Adjust for another variable | ANCOVA |
| Test association | Categorical | Two categorical variables | Chi-square test of independence |
| Test expected counts | Categorical | One categorical variable | Chi-square goodness-of-fit |
| Test relationship | Continuous | Two continuous variables | Pearson correlation |
| Test ranked relationship | Ordinal or non-normal | Ranked or ordinal variables | Spearman correlation |
| Predict continuous outcome | Continuous | One or more predictors | Linear regression |
| Predict binary outcome | Binary | Two outcome categories | Binary logistic regression |
| Predict unordered categories | Categorical | Three or more unordered outcomes | Multinomial logistic regression |
| Predict ordered categories | Ordinal | Ordered outcome levels | Ordinal logistic regression |
This table is a guide, not a replacement for assumption checks or supervisor instructions.
How to Use the Statistical Test Selection Chart
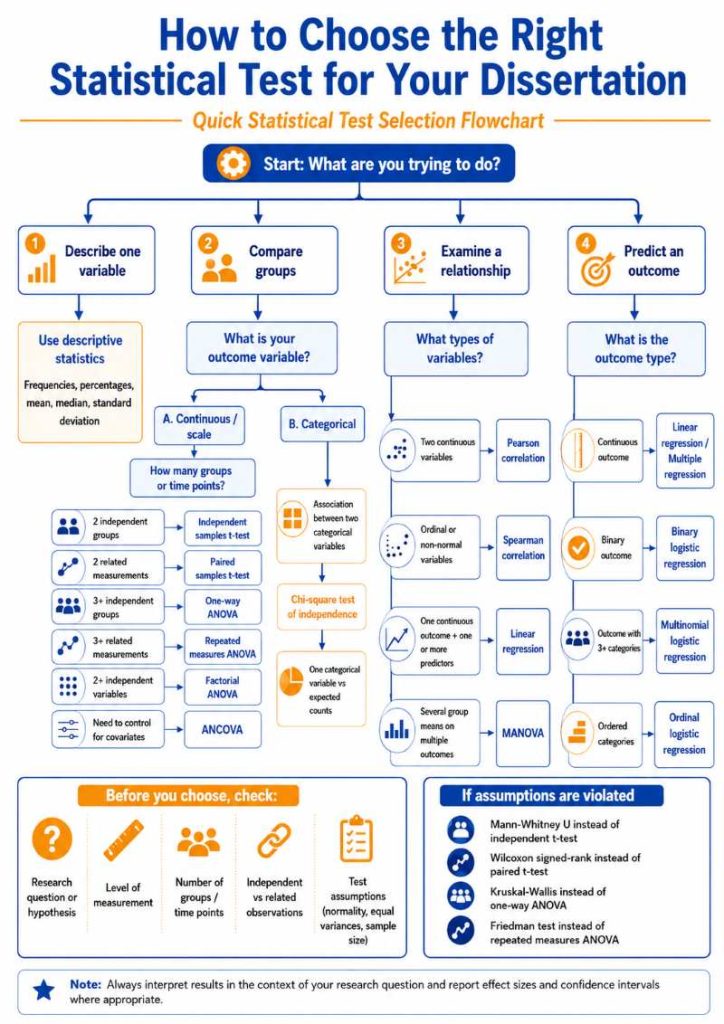
The chart above summarizes the decision process explained in this article. Use it after reading the steps, not before. It works best as a final checklist.
To use the chart:
- Start at the top and ask what your research question is trying to do.
- Choose whether your goal is to describe, compare, examine a relationship, or predict an outcome.
- If you are comparing groups, check whether your outcome variable is continuous or categorical.
- If the outcome is continuous, check the number of groups or time points.
- If your variables are categorical, consider chi-square tests.
- If you are examining relationships, check whether your variables are continuous, ordinal, or non-normal.
- If you are predicting an outcome, identify whether the outcome is continuous, binary, unordered categorical, or ordinal.
- Before making the final choice, check assumptions such as normality, equal variances, independence, and sample size.
- If assumptions are not met, consider the nonparametric alternatives listed in the chart.
This chart is useful when you need a quick reminder, but your final test choice should still match your research question and data structure.
Dissertation Examples: Matching Questions to Statistical Tests
Here are simple examples showing how to move from a research question to a test.
Example 1:
“Do male and female students differ in academic performance?”
Correct test: independent samples t-test.
Reason: There are two independent groups and one continuous outcome.
Example 2:
“Did stress scores decrease after the intervention?”
Correct test: paired samples t-test.
Reason: The same participants were measured before and after the intervention.
Example 3:
“Do students from three departments differ in GPA?”
Correct test: one-way ANOVA.
Reason: There are three independent groups and one continuous outcome.
Example 4:
“Is gender associated with preferred learning mode?”
Correct test: chi-square test of independence.
Reason: Both variables are categorical.
Example 5:
“Do study hours, attendance, and motivation predict GPA?”
Correct test: multiple linear regression.
Reason: The outcome is continuous, and there are several predictors.
These examples show why test selection should always begin with the research question.
When to Ask for Statistical Help
You may need statistical help if you are unsure how to connect your research questions to the correct test.
This is common when your dissertation has many variables, several hypotheses, mixed variable types, or unclear supervisor instructions.
You may also need help if your dataset needs cleaning, recoding, assumption testing, or APA-style results interpretation.
Getting help before analysis can save time. It can also prevent major problems in the results chapter.
If your project is a dissertation or thesis, our dissertation statistics help and SPSS dissertation help services can help you choose, run, and report the correct tests.
Final Checklist Before Choosing a Statistical Test
Before you choose a statistical test, ask yourself these questions:
- What is my main research question?
- What is my dependent variable?
- What is my independent variable or predictor?
- Is my dependent variable continuous, categorical, binary, or ordinal?
- Am I describing, comparing, relating, or predicting?
- How many groups or time points do I have?
- Are the observations independent or related?
- Do the data meet the assumptions of the test?
- Do I need a nonparametric alternative?
- Can I justify the test clearly in my dissertation?
If you can answer these questions, you are much closer to choosing the right test.
If you cannot answer them, do not rush into SPSS. Go back to your research questions, hypotheses, variables, and study design.
A strong dissertation analysis begins before you run the test.
Conclusion
Choosing the right statistical test for your dissertation is easier when you follow a clear process.
Start with your research question. Then identify your dependent and independent variables. Check the level of measurement, the number of groups or time points, and whether your observations are independent or related. After that, check the assumptions and decide whether a parametric or nonparametric test is more suitable.
If you are comparing two independent groups, you may need an independent samples t-test. If you are comparing three or more groups, you may need ANOVA. If both variables are categorical, a chi-square test may fit. If you are predicting an outcome, regression may be the right approach.
The best statistical test is not the most complicated one. It is the one that matches your research question, variables, design, and assumptions.