When you need to compare the average values of three or more groups, a one-way ANOVA is often the right test. It is one of the most common methods in statistics, but many beginners find it intimidating because the name sounds technical.
The good news is that the core idea is simple. A one-way ANOVA helps you test whether the means of several independent groups are significantly different from each other. Instead of running many separate t-tests, you use one overall test.
This guide explains one-way ANOVA in a clear and beginner-friendly way. You will learn what it is, when to use it, what the assumptions mean, how the ANOVA table works, how the values are calculated, what post hoc tests do, and how to interpret the results.
If you want to apply the test in software, read our guide on how to run a one-way ANOVA in SPSS. However, if you know how to run the test but want help writing up your findings, see our complete guide on reporting one-way ANOVA results in APA.
What Is a One-Way ANOVA?
A one-way ANOVA is a statistical test used to compare the means of three or more independent groups. Its main purpose is to determine whether at least one group mean differs from the others.
The term ANOVA stands for analysis of variance. That can sound confusing because the test compares means. However, it does this by studying how much variation exists between groups and within groups.
The phrase one-way means there is only one independent variable. That variable is categorical and divides the sample into groups. For example, you may compare exam scores across three teaching methods, blood pressure across four treatment groups, or customer satisfaction across several branches.
The dependent variable in a one-way ANOVA must be continuous. This means it should be numeric, such as score, time, weight, income, or satisfaction level.
In simple terms, one-way ANOVA asks this question: Are the group averages different enough that the difference is unlikely to be caused by chance alone?
Quick Summary Table: One-Way ANOVA at a Glance
| Term | Meaning |
|---|---|
| One-way | One independent variable |
| ANOVA | Analysis of variance |
| Independent variable | Categorical grouping variable |
| Dependent variable | Continuous outcome variable |
| Main purpose | Compare means across 3 or more groups |
What Does a One-Way ANOVA Test?
A one-way ANOVA tests whether the means of multiple groups are equal in the population. It does this using a null hypothesis and an alternative hypothesis.
The null hypothesis states that all group means are equal. This means any observed differences in the sample are assumed to be due to random variation.
H₀: μ₁ = μ₂ = μ₃ = …
The alternative hypothesis states that at least one group mean is different. It does not tell you which specific group differs. It only tells you that the means are not all equal.
This is a key point for beginners. A significant ANOVA result does not prove that every group differs from every other group. It only shows that at least one difference exists somewhere among the groups.
For example, if you compare lecture, discussion, and blended learning groups, a significant result means at least one teaching method has a different mean score. To identify the exact differences, you need a post hoc test after the ANOVA.
When Should You Use a One-Way ANOVA?
A one-way ANOVA is appropriate when your study is about comparing group means using one grouping factor. It works well when you want one overall test instead of several separate comparisons.
Use a one-way ANOVA when:
- You have one independent variable
- The independent variable has three or more groups
- You have one continuous dependent variable
- The observations are independent
Common examples include comparing mean exam scores across teaching methods, average recovery time across treatment groups, or satisfaction scores across departments.
If you have only two groups, an independent samples t-test is usually more suitable. If you have two independent variables, then a two-way ANOVA is often a better choice.
One-way ANOVA is especially useful because it reduces the problem of inflated Type I error that can happen when many t-tests are run separately.
Summary Table: When to Use One-Way ANOVA
| Situation | Use One-Way ANOVA? |
|---|---|
| Compare 3 teaching methods on exam scores | Yes |
| Compare 4 diets on weight loss | Yes |
| Compare 2 groups only | No, usually t-test |
| Compare 2 factors together | No, usually two-way ANOVA |
| Dependent variable is categorical | No |
The Variables in a One-Way ANOVA
A one-way ANOVA always has two main variables. Understanding them early makes the rest of the test much easier to follow.
The independent variable is the grouping variable. It must be categorical. This means it divides the sample into separate groups or levels. Examples include treatment type, department, fertilizer type, teaching method, or region.
The dependent variable is the outcome being measured. It must be continuous. This means it is numeric and can take a range of values. Examples include test scores, income, weight, reaction time, blood pressure, or satisfaction scores.
Here are a few examples:
- Teaching method: lecture, discussion, blended
Dependent variable: exam score - Fertilizer type: A, B, C, D
Dependent variable: crop yield - Hospital department: emergency, surgery, maternity
Dependent variable: job satisfaction score
If the dependent variable is categorical, one-way ANOVA is not the correct test. Also, if the independent variable does not separate the data into groups, ANOVA will not fit the research question.
Why Is It Called Analysis of Variance?
Many beginners wonder why the test is called analysis of variance if it compares means. The answer is that ANOVA compares means by studying variation.
It looks at two types of variation:
- Between-group variation: how much the group means differ from the grand mean
- Within-group variation: how much individual scores differ from their own group mean
If the groups are truly different, the variation between groups will be relatively large. If the groups are not truly different, then most of the variation will appear within groups instead.
ANOVA combines this logic into the F-statistic. The F-value compares between-group variation to within-group variation. A larger F-value suggests that the group means are more spread out than we would expect by chance.
So even though the final goal is to compare means, the test reaches that conclusion through variance. That is why the name makes sense.
One-Way ANOVA vs t-Test vs Two-Way ANOVA
One-way ANOVA is often confused with related tests. The easiest way to separate them is to look at the number of groups and the number of independent variables.
An independent samples t-test compares the means of two independent groups. A one-way ANOVA compares the means of three or more independent groups using one independent variable. A two-way ANOVA uses two independent variables and can also test interaction effects.
For example:
- Comparing men and women on exam scores: independent samples t-test
- Comparing three teaching methods on exam scores: one-way ANOVA
- Comparing teaching method and gender together: two-way ANOVA
Comparison Table: Related Mean Comparison Tests
| Test | Number of Independent Variables | Number of Groups |
|---|---|---|
| Independent samples t-test | 1 | 2 |
| One-way ANOVA | 1 | 3 or more |
| Two-way ANOVA | 2 | 2 or more per factor |
Once you identify how many groups you have and how many predictors are involved, choosing the right test becomes easier.
Assumptions of One-Way ANOVA
Before interpreting one-way ANOVA results, you should check whether the basic assumptions are reasonably met. These assumptions support valid conclusions.
The main assumptions are:
- Independent observations. Each score should be unrelated to the others. One participant’s result should not influence another participant’s result.
- Continuous dependent variable. The outcome should be numeric, such as score, time, income, or weight.
- Categorical independent variable. The grouping variable should divide the data into categories or levels.
- Normality within groups. The dependent variable should be approximately normally distributed in each group.
- Homogeneity of variances. The spread of scores should be roughly similar across groups.
Mild violations of normality may not be serious, especially with moderate or large samples. However, serious violations of independence or major variance differences can affect the analysis.
Summary Table: One-Way ANOVA Assumptions
| Assumption | What It Means | Why It Matters |
|---|---|---|
| Independence | Observations are unrelated | Prevents biased results |
| Continuous outcome | Dependent variable is numeric | Required for mean comparison |
| Categorical factor | Independent variable forms groups | Required for group testing |
| Normality | Scores are roughly normal in each group | Supports valid inference |
| Equal variances | Group variances are similar | Helps the standard ANOVA work properly |
A Simple Example of One-Way ANOVA
Suppose a researcher wants to know whether three teaching methods lead to different average exam scores. The methods are lecture, discussion, and blended learning. The dependent variable is exam score.
The null hypothesis says that the mean exam score is the same for all three groups. The alternative hypothesis says that at least one group mean is different.
Imagine the sample means look like this:
| Teaching Method | Mean Exam Score |
|---|---|
| Lecture | 6 |
| Discussion | 10 |
| Blended Learning | 11 |
At first glance, the means look different. However, sample means can differ by chance even when the population means are equal. One-way ANOVA helps determine whether the differences are large enough to suggest a real population difference.
If the ANOVA result is significant, the researcher concludes that at least one teaching method differs in mean score. The next step is to use a post hoc test to identify which groups differ.
This example shows why ANOVA is useful. It gives one overall test instead of several separate t-tests.
How the F-Statistic Works
The central statistic in one-way ANOVA is the F-statistic. It is a ratio that compares between-group variation to within-group variation.
If the group means are far apart, between-group variation becomes larger. If the scores within each group are closely clustered, within-group variation becomes smaller. When this happens, the F-value becomes larger.
A large F-value suggests that the differences among the group means are unlikely to be due to chance alone. A small F-value suggests that the mean differences are not much larger than the normal variation already present within the groups.
The F-statistic is then used to obtain a p-value. The p-value tells you whether the result is statistically significant at your chosen alpha level, which is often .05.
You do not need to calculate F by hand every time to understand the meaning of the test. What matters most is knowing that ANOVA compares two kinds of variation and uses that comparison to judge whether the group means differ significantly.
How to Calculate One-Way ANOVA Values Manually
The ANOVA table may look technical, but each value follows a clear sequence. Once you understand the steps, the table becomes much easier to follow.
We calculate the values in this order:
- Find the group means and grand mean
- Calculate the sum of squares between groups
- Calculate the sum of squares within groups
- Calculate the total sum of squares
- Find the degrees of freedom
- Compute the mean squares
- Compute the F-ratio
- Construct the ANOVA table
The worked example below uses the same three teaching groups introduced above.
Step 1: Calculate the Group Means and Grand Mean
Here are the group scores and means:
| Group | Scores | Mean |
|---|---|---|
| Lecture | 6, 8, 4 | 6 |
| Discussion | 8, 12, 10 | 10 |
| Blended | 13, 9, 11 | 11 |
The grand mean is 9
The grand mean is important because it is used to measure how far each group’s mean is from the overall average.
Step 2: Calculate Sum of Squares Between Groups
The sum of squares between groups measures how far each group’s mean is from the grand mean.
The formula is:
Now substitute the values:
So:
Step 3: Calculate Sum of Squares Within Groups
The sum of squares within groups measures how much the individual scores vary around their own group mean.
The formula is:
Lecture group: The sum of squares within is:
Discussion group: The sum of squares within is:
For the blended group: The sum of squares within is:
Now add them to get the total sum of squares within. That’s:
So:
Step 4: Calculate Total Sum of Squares
The total sum of squares measures how much every score varies from the grand mean.
The formula is:
Using the grand mean of 9:
So:
You can confirm the result using:
That check confirms the calculations are correct.
Step 5: Calculate the Degrees of Freedom
Now, calculate the degrees of freedom for each source of variation.
For between groups:
There are 3 groups, so:
For within groups:
There are 9 observations and 3 groups, so:
For total:
Step 6: Calculate the Mean Squares
The mean square is found by dividing the sum of squares by its degrees of freedom.
For between groups:
For within groups:
So we have:
Step 7: Calculate the F-Statistic
The final step is to calculate the F-ratio:
Substitute the values:
So the final test statistic is:
This is the F-value reported in the ANOVA table.
Step 8. Construct the ANOVA table
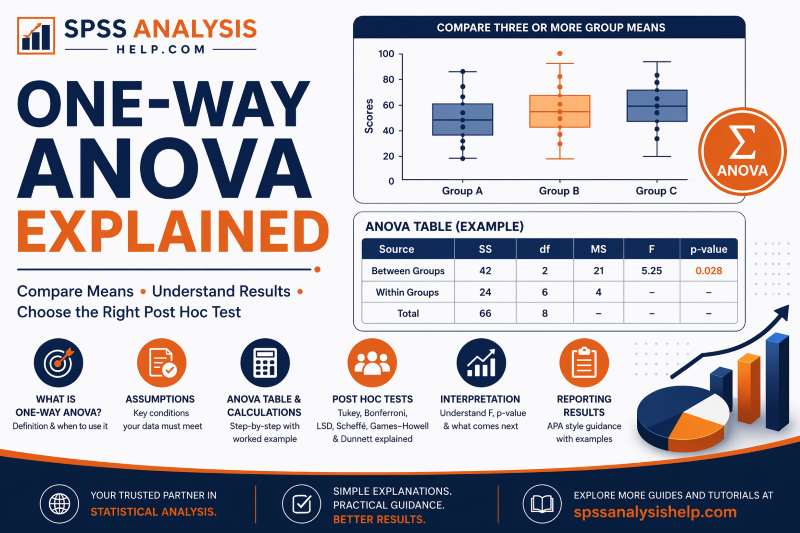
Now that all the values have been calculated, the complete ANOVA table looks like this:
| Source of Variation | Sum of Squares (SS) | df | Mean Square (MS) | F |
|---|---|---|---|---|
| Between Groups | 42 | 2 | 21 | 5.25 |
| Within Groups | 24 | 6 | 4 | |
| Total | 66 | 8 |
This table shows that the between-group variation is larger than the within-group variation. That produces an F-statistic of 5.25.
If this F-value gives a p-value below .05, you would conclude that at least one group mean differs significantly from the others.
Formula Summary for a One-Way ANOVA Table
This summary table is useful because it brings the key one-way ANOVA formulas together in one place.
| Component | Formula |
|---|---|
| Grand Mean | |
| SS Between | |
| SS Within | |
| SS Total | |
| df Between | |
| df Within | |
| df Total | |
| MS Between | |
| MS Within | |
| F |
How to Interpret One-Way ANOVA Results
When reading one-way ANOVA output, the most important values are usually the F-statistic, the degrees of freedom, and the p-value.
The F-statistic shows the ratio of between-group variation to within-group variation. The degrees of freedom give context for the test and are reported with the F-value. The p-value tells you whether the result is statistically significant.
If the p-value is less than your significance level, usually .05, you reject the null hypothesis. This means there is evidence that at least one group mean differs from the others.
If the p-value is greater than .05, you fail to reject the null hypothesis. This means the data do not provide enough evidence to conclude that the group means differ significantly.
Summary Table: Reading One-Way ANOVA Output
| Output Item | What to Check | Meaning |
|---|---|---|
| F | Size of the test statistic | Compares between- and within-group variation |
| df | Report with F | Shows degrees of freedom |
| p-value | Compare to .05 | Shows whether the result is statistically significant |
A significant result tells you that a difference exists. It does not tell you exactly which groups differ.
Post Hoc Tests in One-Way ANOVA
A significant one-way ANOVA tells you that at least one group mean is different. It does not tell you which specific groups differ. That is why post hoc tests are essential.
Post hoc tests are follow-up comparisons done after a significant ANOVA result. They compare group pairs while controlling, to different degrees, for the increased risk of Type I error that comes from multiple comparisons.
For example, if you compare three teaching methods and get a significant ANOVA result, the ANOVA tells you that the means are not all equal. A post hoc test then helps you determine whether:
- Lecture differs from discussion
- Lecture differs from blended learning
- Discussion differs from blended learning
Without a post hoc test, your conclusion stays incomplete. You would know that a difference exists somewhere, but not where it exists.
For a beginner reading this topic for the first time, this is one of the most important ideas to understand: ANOVA gives the overall signal, and post hoc tests show the exact group differences.
Common Post Hoc Tests and When to Use Them
There are several post hoc tests, and the best choice depends on your goal, your sample sizes, and whether the equal variance assumption is met. Below are the most common ones beginners should know.
Tukey’s HSD
Tukey’s Honestly Significant Difference is one of the most widely used post hoc tests in one-way ANOVA. It is designed for comparing all possible pairs of group means.
Use Tukey’s HSD when:
- The overall ANOVA is significant
- You want to compare every group with every other group
- Group variances are reasonably equal
- Sample sizes are equal or fairly similar
Tukey is popular because it is easy to interpret and works well in many standard ANOVA situations.
Example: If you compare four diets and want to test every possible pair of diets, Tukey’s HSD is usually a strong choice.
Bonferroni
The Bonferroni method adjusts the significance level to reduce the chance of false positives when multiple comparisons are made. It is simple and widely respected.
Use Bonferroni when:
- You have a smaller number of planned pairwise comparisons
- You want a cautious approach
- You want strong control over Type I error
Bonferroni can be more conservative than Tukey. That means it reduces false positives, but it may also reduce power.
Example: If you only care about comparing the control group with two treatment groups, Bonferroni may be appropriate.
LSD
LSD, which stands for Least Significant Difference, is another post hoc method often seen in introductory statistics and in SPSS output options. It is simpler and less conservative than many other post hoc tests.
Use LSD when:
- The overall ANOVA is significant
- You want pairwise comparisons
- You are comfortable with a less strict approach to Type I error
- The number of groups is not too large
LSD can be attractive because it is easy to use and may detect differences that stricter tests miss. However, it does not control familywise error as strongly as Tukey or Bonferroni when many comparisons are made.
Example: If you have a small number of groups and want a more liberal post hoc test, LSD may be used. Still, many researchers prefer Tukey or Bonferroni when stronger error control is needed.
Scheffé Test
The Scheffé test is one of the most conservative post hoc procedures. It is flexible because it can be used not only for pairwise comparisons but also for more complex comparisons.
Use Scheffé when:
- You want a very cautious test
- You may examine many possible comparisons
- You want flexibility beyond simple pairwise tests
Because it is conservative, Scheffé may be less likely to detect differences than Tukey or LSD.
Example: If a researcher wants to test several custom contrasts, not only all pairwise comparisons, Scheffé may be a good option.
Games–Howell
The Games–Howell test is very useful when the assumption of equal variances is violated. It is also helpful when group sizes are unequal.
Use Games–Howell when:
- Variances are unequal
- Sample sizes differ across groups
- You still need pairwise comparisons after a significant overall result
This is often one of the best alternatives when Tukey is not suitable because the homogeneity of variances is not met.
Example: If you compare four departments and Levene’s test is significant, Games–Howell is often more appropriate than Tukey.
Dunnett Test
The Dunnett test is used when you want to compare several treatment groups against one control group rather than comparing every group with every other group.
Use Dunnett when:
- You have one control group
- Your main interest is to compare each treatment to the control
- You do not need all pairwise comparisons
This makes Dunnett more focused than Tukey and often more efficient for that specific research goal.
Example: If you are comparing three new teaching methods to the standard lecture method, Dunnett may be a better choice than Tukey.
Quick Summary Table: Post Hoc Tests
| Post Hoc Test | Best Used When | Main Strength | Caution |
|---|---|---|---|
| Tukey’s HSD | All pairwise comparisons with equal variances | Common and easy to interpret | Less ideal when variances are unequal |
| Bonferroni | Small number of planned comparisons | Strong error control | Can be overly conservative |
| LSD | Pairwise comparisons when a liberal test is acceptable | Simple and sensitive | Weaker control of Type I error |
| Scheffé | Many or complex comparisons | Very flexible | Often conservative |
| Games–Howell | Variances are unequal and group sizes differ | Good under unequal variances | Not usually the first choice when variances are equal |
| Dunnett | Comparing groups to one control | Focused and efficient | Not meant for all pairwise comparisons |
How to Choose the Right Post Hoc Test
If you are not sure which post hoc test to use, this guide can help.
- Use Tukey’s HSD when you want all pairwise comparisons and the equal variance assumption is met.
- Use Games–Howell when variances are unequal or sample sizes are clearly different.
- Use Bonferroni when you have only a few planned comparisons and want strong error control.
- Use LSD when a more liberal pairwise approach is acceptable and the number of groups is limited.
- Use Dunnett when all comparisons are against one control group.
- Use Scheffé when you want a conservative method or need more flexible comparisons.
For many beginner-level analyses, Tukey’s HSD and Games–Howell are the two most practical post hoc tests to understand first. Still, it is helpful to know that LSD is also commonly used, especially in SPSS and some applied research settings.
Example of Post Hoc Interpretation
Suppose a one-way ANOVA shows a significant difference in exam scores across three teaching methods: lecture, discussion, and blended learning. You then run Tukey’s HSD.
The post hoc results might show that:
- blended learning differs significantly from lecture
- discussion does not differ significantly from lecture
- blended learning does not differ significantly from discussion
This gives a much clearer conclusion than the ANOVA alone. Instead of saying only that a difference exists, you can explain exactly which teaching methods differ and which do not.
If you used LSD instead, you might find similar pairwise patterns, but the test would be more liberal. That means it may identify differences more easily, though with less protection against false positives.
What If the Result Is Not Significant?
A non-significant one-way ANOVA means there is not enough evidence to conclude that the group means differ in the population.
This does not always mean the means are exactly equal. It only means the observed differences in your sample are not large enough, relative to the variation in the data, to rule out chance as a likely explanation.
A non-significant result may happen because:
- The groups are truly similar
- The sample size is too small
- There is too much variation within groups
- The real effect is weak
In most cases, post hoc tests are not needed after a non-significant ANOVA because the overall test did not show evidence of group differences.
Non-significant results can still be useful. They may suggest that a treatment had little effect, that the groups were more similar than expected, or that more data may be needed in future research.
What If the Assumptions Are Violated?
Not every dataset will meet the assumptions of one-way ANOVA perfectly. The key is to understand what kind of violation exists and how serious it is.
Here are common responses:
- If normality is only slightly violated
ANOVA may still work reasonably well, especially with moderate or large samples. - If variances are unequal
Consider Welch ANOVA for the overall test and Games–Howell for post hoc comparisons. - If the dependent variable is not continuous
One-way ANOVA is not appropriate, so another method should be chosen. - If the data are very non-normal or heavily influenced by outliers
A nonparametric alternative such as the Kruskal–Wallis test may be more suitable. - If independence is violated
This is a serious problem because the observations are no longer truly separate.
The best practice is to check assumptions before interpreting the p-value. A statistically significant result is only useful when the method itself is appropriate for the data.
How to Report One-Way ANOVA Results
When reporting a one-way ANOVA, you should clearly state the test used, the F-statistic, the degrees of freedom, and the p-value. If the result is significant, you should also report the post hoc findings.
A simple APA-style example looks like this:
A one-way ANOVA was conducted to compare exam scores across three teaching methods. The results showed a statistically significant difference in mean exam scores among the groups, F(2, 6) = 5.25, p < .05. Tukey post hoc comparisons indicated that the blended learning group scored significantly higher than the lecture group.
This format helps readers understand the overall test, the significant result, and the follow-up comparisons.
If you want a full formatting guide with more examples, see our article on reporting one-way ANOVA results in APA.
Common Mistakes to Avoid
Many beginners understand the basic idea of ANOVA but still make avoidable mistakes. These mistakes can weaken the analysis or lead to poor interpretation.
Common mistakes include:
- Using one-way ANOVA for only two groups
In that case, an independent samples t-test is usually better. - Using a categorical dependent variable
One-way ANOVA requires a continuous numeric outcome. - Ignoring the assumptions
A p-value should not be trusted without checking whether the method fits the data. - Thinking a significant ANOVA means all groups differ
A significant result only shows that at least one difference exists. - Skipping post hoc tests
Without post hoc tests, you do not know which groups differ. - Choosing an unsuitable post hoc test
For example, using Tukey when variances are clearly unequal may not be ideal. - Treating LSD as always best because it finds more differences
LSD is more liberal, so it can increase false positives when many comparisons are made. - Focusing only on statistical significance
Group means, context, and practical meaning also matter.
Avoiding these mistakes will make your ANOVA results more accurate and more useful.
One-Way ANOVA Explained in One Table
Sometimes the easiest way to understand a method is to see the main ideas in one place.
| Question | Answer |
|---|---|
| What is one-way ANOVA? | A test used to compare the means of 3 or more independent groups |
| Why is it called one-way? | Because it uses one independent variable |
| What type of dependent variable is needed? | A continuous numeric variable |
| What does the null hypothesis say? | All group means are equal |
| What does a significant result mean? | At least one group mean differs |
| Does ANOVA show which groups differ? | No, you need a post hoc test |
| What statistic does ANOVA use? | The F-statistic |
| What if variances are unequal? | Consider Welch ANOVA and Games–Howell |
| Is LSD a post hoc option? | Yes, but it is more liberal than many alternatives |
Conclusion
One-way ANOVA is one of the most useful tests for comparing the means of three or more independent groups. Once you understand the variables, assumptions, ANOVA table, F-statistic, and post hoc tests, the method becomes much easier to follow.
The main idea is simple. One-way ANOVA checks whether the differences among group means are large enough to suggest a real difference in the population. If the result is significant, post hoc tests help you identify the exact groups that differ.
That is why a good ANOVA interpretation should never stop at the overall p-value. Readers want to know not only whether a difference exists, but also where that difference appears and how to interpret it.
Frequently Asked Questions
A one-way ANOVA uses one independent variable, while a two-way ANOVA uses two independent variables. A two-way ANOVA can also test interaction effects between the two factors.
You can, but it is usually better to use an independent samples t-test when you only have two groups. One-way ANOVA is mainly used for three or more groups.
You need one categorical independent variable and one continuous dependent variable. The observations should also be independent.
You should run a suitable post hoc test to determine which specific groups differ. Common options include Tukey’s HSD, Games–Howell, Bonferroni, LSD, Scheffé, and Dunnett.
You may need a more robust alternative, such as Welch ANOVA, or a nonparametric option like the Kruskal–Wallis test, depending on the type of violation.
The ANOVA itself mainly tells you whether a statistically significant difference exists. To understand the size of the difference, you should also examine effect sizes and group means.