Many students can run a one-sample t-test in SPSS, but they get stuck when it is time to write the result in APA style. The output gives the numbers, but it does not tell you how to turn those numbers into a clear academic paragraph. As a result, many students either report too little, format the result wrongly, or fail to explain what the finding actually means. This guide explains how to report a one-sample t-test result in APA style. Throughout the guide, we’ll use the SPSS output from our previous guide on how to perform a one-sample t-test in SPSS. This guide is perfect for students, researchers, and dissertation writers who want to present one-sample t-test results correctly in assignments, theses, dissertations, and research papers. The example used here is based on daily study hours, where the sample mean was compared to a test value of 5 hours.
Still new to statistics and want a clearer understanding of the one-sample t-test? Check out our complete guide on the one-sample t-test to learn what it is, when to use it, its assumptions, hypotheses, and practical examples.
What a One-Sample T-Test Does
A one-sample t-test is used when you want to test whether the mean of one sample differs significantly from a known, hypothesized, or benchmark value.
In simple terms, it answers the research question: Is the average for this sample different from the value I want to compare it to?
This test is commonly used when a researcher wants to compare a sample mean with:
- A target score. For example, a class average may be compared to a pass mark.
- A neutral midpoint. For example, a satisfaction mean may be compared to the midpoint of a scale.
- A known population value. A sample may be compared to a previously reported average.
- A theoretical or policy benchmark. Some studies compare results against a value that has practical or institutional meaning.
The SPSS Output Used in This Example
From the one-sample t-test guide, we used the following example.
Suppose a researcher wants to determine whether the average daily study time of university students differs from 5 hours. The researcher collects study time data from 30 students and records the number of hours each student studies per day.
Running the test in SPSS yielded these outputs
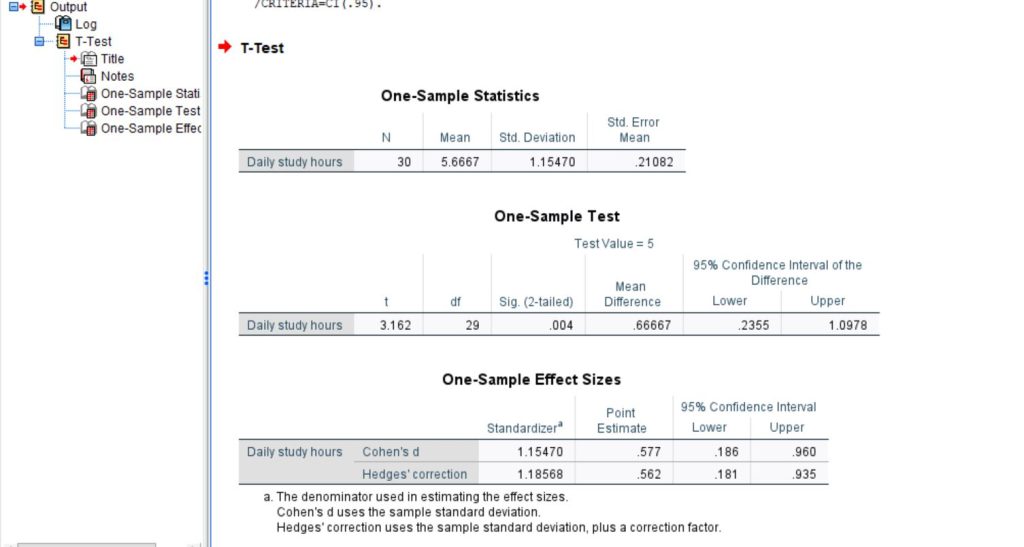
From the attached SPSS outputs, we can see that:
- N = 30. This means 30 observations were included in the test.
- Mean = 5.6667. This is the sample average for daily study hours.
- Standard deviation = 1.15470. This shows how much variation there was around the mean.
- t = 3.162. This is the test statistic.
- df = 29. For a one-sample t-test, degrees of freedom are usually calculated as n – 1.
- Sig. (2-tailed) = .004. This is the p-value.
- Mean difference = .66667. This means the sample mean was about 0.67 hours above the benchmark value of 5.
- 95% confidence interval = [.2355, 1.0978]. This gives the likely range for the true mean difference.
- Cohen’s d = .577. This is the effect size.
In APA style, these are usually rounded as follows:
- M = 5.67
- SD = 1.15
- t(29) = 3.16
- p = .004
- 95% CI [0.24, 1.10]
- d = 0.58
These values tell us that the sample mean was above 5 hours and that the difference was statistically significant.
What to Include in an APA Report
When writing a one-sample t-test in APA style, do not just report the p-value. A stronger write-up should include the main pieces of information that help the reader understand both the result and its meaning.
A good one-sample t-test APA report usually includes:
- The name of the test. State that a one-sample t-test was conducted.
- The variable that was tested. Tell the reader what outcome was analyzed.
- The benchmark or test value. Make it clear what the sample mean was compared against.
- The sample mean and standard deviation. These descriptive statistics give the result context.
- The t-value and degrees of freedom. This is the core APA statistical format.
- The p-value. This tells the reader whether the difference was statistically significant.
- The direction of the difference. Explain whether the sample mean was higher or lower than the test value.
- The effect size, when appropriate. This helps show whether the difference is small, moderate, or large.
- The confidence interval. This gives extra detail about the estimated mean difference.
The key idea is simple: readers should not have to guess what happened.
The Basic APA Format
A common APA sentence for a one-sample t-test looks like this:
A one-sample t-test showed that [variable] was significantly [higher/lower/different] than the test value of [value], M = [mean], SD = [standard deviation], t(df) = [t value], p = [p value].
Using your SPSS output, that becomes:
A one-sample t-test showed that daily study hours were significantly higher than the test value of 5, M = 5.67, SD = 1.15, t(29) = 3.16, p = .004.
That is the short version. It is clean, acceptable, and appropriate for many class assignments. However, if you want a slightly fuller version, you can add effect size:
A one-sample t-test showed that daily study hours were significantly higher than the test value of 5, M = 5.67, SD = 1.15, t(29) = 3.16, p = .004, d = 0.58.
However, if you also want to include the confidence interval, you can write:
A one-sample t-test showed that daily study hours were significantly higher than the test value of 5, M = 5.67, SD = 1.15, t(29) = 3.16, p = .004, mean difference = 0.67, 95% CI [0.24, 1.10].
How to Build the Result Step by Step
A strong one-sample t-test paragraph usually does three things. It introduces the purpose, reports the result, and explains what the finding means.
You can build it like this:
- Start with the purpose of the test. Example: A one-sample t-test was conducted to determine whether students’ daily study hours differed from 5 hours per day.
- Report the descriptive and inferential statistics. Example: The sample mean was 5.67 hours (SD = 1.15), which was significantly higher than the test value of 5, t(29) = 3.16, p = .004.
- Interpret the result in plain academic language. Example: This suggests that students in the sample studied more than 5 hours per day on average.
When combined, the paragraph becomes:
A one-sample t-test was conducted to determine whether students’ daily study hours differed significantly from 5 hours per day. The sample mean was 5.67 hours (SD = 1.15), which was significantly higher than the test value of 5, t(29) = 3.16, p = .004. This suggests that students in the sample studied more than 5 hours per day on average.
That version is already strong. It tells the reader what was tested, what happened, and what it means.
A Full APA Paragraph for One-Sample T-Test Result from the SPSS Output
For a dissertation, thesis, or stronger results section, it is often better to give a slightly fuller interpretation.
Here is a polished paragraph based directly on your output:
A one-sample t-test was conducted to examine whether the average number of daily study hours differed from the benchmark value of 5 hours. Results showed that the mean daily study time was 5.67 hours (SD = 1.15), which was significantly higher than the benchmark, t(29) = 3.16, p = .004. The mean difference was 0.67 hours, and the 95% confidence interval ranged from 0.24 to 1.10. The effect size was moderate, Cohen’s d = 0.58. These findings indicate that students in the sample studied significantly more than 5 hours per day on average.
This version is stronger because it includes:
- The purpose of the test
- The mean and standard deviation
- The test statistic
- The degrees of freedom
- The p-value
- The mean difference
- The confidence interval
- The effect size
- A plain-language interpretation
How to Read the Right Values From SPSS
One of the most common reasons students struggle with APA reporting is that they take values from the wrong SPSS table. The output may look straightforward at first, but each table has a different purpose. Knowing where each value comes from makes the reporting process much easier and helps prevent avoidable mistakes.
For a one-sample t-test, focus on the three main tables in the output:
- One-Sample Statistics
Use this table for the descriptive values: N, Mean, and Standard Deviation. These numbers describe the sample and should usually appear in your APA write-up. - One-Sample Test
Use this table for the main test results: t, df, Sig. (2-tailed), Mean Difference, and the 95% Confidence Interval of the Difference. These values tell you whether the sample mean differs significantly from the test value. - One-Sample Effect Sizes
Use this table for Cohen’s d and, where needed, the confidence interval for the effect size. This information is especially useful in stronger academic reports because it helps show the size of the difference, not just whether it was statistically significant.
From your SPSS output, the most important values are:
- N = 30
- M = 5.67
- SD = 1.15
- t(29) = 3.16
- p = .004
- Mean difference = 0.67
- 95% CI [0.24, 1.10]
- Cohen’s d = 0.58
Once you know where these numbers come from, the APA write-up becomes much more manageable. You are no longer trying to interpret the whole output at once. Instead, you are simply pulling the right values from the right places and turning them into a clear academic sentence.
How to Interpret the Result Correctly
A strong APA report does more than list the numbers from SPSS. It also explains what those numbers mean in relation to the research question. This matters because a reader should not have to work out the interpretation alone.
In this example, the result is fairly easy to interpret once you look at the key values together.
- The sample mean was higher than the test value.
The average number of daily study hours in the sample was 5.67, while the test value was 5. This shows that the sample mean was 0.67 hours higher than the benchmark. - The p-value shows that the difference was statistically significant.
The p-value was .004, which is below the common significance level of .05. This means the difference between the sample mean and the test value is unlikely to be due to random chance alone. - The confidence interval supports the same conclusion.
The 95% confidence interval for the mean difference ranged from 0.24 to 1.10. Because the entire interval is above 0, it supports the conclusion that the sample mean was higher than the test value. - The effect size shows that the difference was meaningful.
Cohen’s d was 0.58, which is typically interpreted as a moderate effect size. This suggests that the difference was not only statistically significant, but also large enough to be practically worth noticing.
Taken together, these results lead to a clear interpretation: Students in the sample studied significantly more than 5 hours per day on average.
How to Report a Non-Significant One-Sample T-Test Result in APA Style
Even though the example in this article was statistically significant, it is just as important to know how to report a non-significant one-sample t-test correctly. Many students get confused at this point because they are unsure how to describe a result that does not reach statistical significance.
The key thing to remember is that a non-significant result does not mean the sample mean and the test value are exactly the same. It simply means that the analysis did not provide enough evidence to conclude that the sample mean was significantly different from the benchmark.
A short APA-style report might look like this:
A one-sample t-test showed that daily study hours did not differ significantly from 5 hours, M = 5.12, SD = 1.08, t(29) = 0.61, p = .547.
The wording matters a lot in non-significant results. In APA style, you should say that the sample mean did not differ significantly from the test value. That is the safest and most accurate phrasing.
You should avoid statements like these:
- The means were the same
- There was no difference at all
- The null hypothesis was proven
- The benchmark was confirmed
Those statements go too far. A non-significant result does not prove equality. It only shows that the evidence was not strong enough to reject the null hypothesis.
A fuller write-up for a dissertation, thesis, or research project should sound a little more developed. For example:
A one-sample t-test was conducted to examine whether students’ average daily study hours differed significantly from the hypothesized value of 5 hours per day. The results indicated that the mean daily study time was 5.12 hours (SD = 1.08). However, this mean was not significantly different from the benchmark value, t(29) = 0.61, p = .547. The findings therefore suggest that the sample did not provide sufficient evidence to conclude that students’ daily study hours differed from 5 hours on average.
Common Mistakes to Avoid
Many one-sample t-test answers lose marks because of avoidable reporting mistakes. Here are some of the most common ones.
- Reporting only the p-value. Writing only “p = .004” is incomplete. The report should also include the mean, standard deviation, t-value, degrees of freedom, and direction.
- Leaving out the benchmark value. Readers need to know what the sample mean was compared against.
- Failing to state the direction. Do not just say there was a significant difference. Say whether the mean was higher or lower than the test value.
- Using too many decimals. APA style usually looks cleaner with sensible rounding. For this example, M = 5.67 is better than M = 5.6667.
- Writing p = .000. If the p-value is extremely small, write p < .001 instead of p = .000.
- Copying raw SPSS output into the text. SPSS tables are useful for analysis, but the results should still be written in proper sentence form.
- Ignoring effect size. Where possible, include the effect size because it tells the reader how large the difference is.
A strong report is not just statistically correct. It is also clear and readable.
Practical Tips for Writing Better One-Sample T-Test APA Results
A few simple habits can make your one-sample t-test reporting much stronger.
- Start with the research question. Before writing, ask yourself what the test was trying to determine.
- Check the mean before the p-value. The mean helps you understand the direction of the result.
- Use simple academic language. Clear sentences are better than complicated ones.
- Include the benchmark early. This helps readers understand the comparison immediately.
- Round consistently. Consistent rounding makes your report look polished.
- Add a plain-language interpretation. After the statistics, tell the reader what the result means in context.
- Use effect size in stronger reports. This is especially useful in theses, dissertations, and journal-style work.
These small improvements make a big difference in the final quality of the write-up.
A Simple One-Sample T-Test APA Table You Can Use
If you want to present the result in table form as well, a simple APA-style table can work nicely.
| Variable | N | M | SD | t | df | p | Mean Difference | 95% CI | Cohen’s d |
|---|---|---|---|---|---|---|---|---|---|
| Daily study hours | 30 | 5.67 | 1.15 | 3.16 | 29 | .004 | 0.67 | [0.24, 1.10] | 0.58 |
Conclusion
Reporting a one-sample t-test in APA style becomes much easier once you know which values to take from SPSS and how to arrange them in a clear sentence. In your example, the mean daily study hours were significantly higher than the benchmark value of 5 hours. A strong report should include the mean, standard deviation, t-value, degrees of freedom, p-value, and direction of the result. Where appropriate, it should also include the confidence interval and effect size.
The most important point is not just to say that the result was significant. It is to show the reader what was tested, what the numbers were, and what the finding means in plain academic language.
When to Seek Help With Reporting a One-Sample T-Test Result in APA
Writing up a one-sample t-test result can look simple at first, but many students still lose marks at this stage. The problem is usually not running the test. The problem is knowing how to present the result clearly, accurately, and in proper APA style.
It may be a good idea to seek help if any of the following sounds familiar:
- You are not sure which values to report.
Many students are unsure whether to include the mean, standard deviation, confidence interval, effect size, or all of them together. - The SPSS output looks clear, but the writing still feels confusing.
It is common to understand the tables and still struggle to turn them into a polished academic paragraph. - You are worried about APA formatting mistakes.
Small issues such as reporting the wrong p format, leaving out degrees of freedom, or using weak wording can make a results section look less professional. - You do not know how to interpret a non-significant result.
Many students are unsure how to explain a result that is not statistically significant without overstating or misrepresenting it. - Your lecturer or supervisor wants more than just the numbers.
In many theses, dissertations, and research projects, you are expected to explain what the result means, not simply copy the SPSS output. - You are writing a dissertation, thesis, or journal-style paper.
Higher-level academic work usually requires more careful reporting, stronger interpretation, and cleaner presentation. - You want confidence before submission.
Sometimes a second review is useful simply to make sure the result is correct, clearly written, and ready to submit.
If you are unsure whether your one-sample t-test result is written correctly, get professional SPSS data analysis services to help you check the output, refine the interpretation, and present the findings in a stronger academic format.