Simple linear regression is one of the most useful methods in statistics. It helps you examine whether one variable can predict another variable.
For example, you may want to know whether study hours predict exam scores. You may also want to know whether advertising spending predicts sales, whether age predicts blood pressure, or whether job stress predicts job satisfaction.
In each case, you have one predictor variable and one outcome variable. Simple linear regression helps you study the relationship between these two variables using a straight-line model.
This guide explains simple linear regression in simple language. You will learn what it means, when to use it, how the equation works, what assumptions you should check, and how to interpret common regression results.
This article does not explain how to run the test in SPSS step by step. For that, read our guide on how to run simple linear regression in SPSS. It also does not cover APA reporting because that should be handled in a separate reporting guide.
What Is Simple Linear Regression?
Simple linear regression is a statistical method used to predict one dependent variable from one independent variable.
The dependent variable is the outcome you want to predict, whereas the independent variable is the predictor you use to make that prediction.
It is called “simple” because it uses only one predictor variable. It is called “linear” because it models the relationship using a straight line.
For example, suppose a researcher wants to know whether study hours predict exam scores. Study hours would be the independent variable. The exam score would be the dependent variable.
Simple linear regression tries to fit the best straight line through the data points. This line shows the predicted value of the outcome for each value of the predictor.
The method is common in education, psychology, business, healthcare, social science, and dissertation research.
Why Is Simple Linear Regression Used?
Simple linear regression is used when you want to understand or predict an outcome using one predictor.
It helps answer questions such as:
- Does study time predict exam performance?
- Does advertising spending predict sales?
- Does age predict blood pressure?
- Does income predict monthly spending?
- Does job stress predict job satisfaction?
Simple linear regression does more than show whether two variables are related. It also estimates how much the outcome changes when the predictor increases by one unit.
For example, if study hours predict exam scores, regression can estimate how many points the exam score increases for each extra hour of study.
This makes simple linear regression useful for research questions about prediction, explanation, and relationships between quantitative variables.
Struggling to choose the right statistical test for your research question? You may find our guide on how to choose the right statistical test for your dissertation helpful.
Simple Linear Regression Example
Let us use a simple example throughout this article.
A lecturer wants to know whether the number of hours students study each week predicts their final exam score.
In this example:
- Independent variable: study hours
- Dependent variable: exam score
The research question may be:
Do study hours predict exam scores?
The expected relationship may be that students who study for more hours tend to score higher in the exam.
Simple linear regression can help test this idea. It can show whether study hours significantly predict exam scores. It can also estimate how much the exam score is expected to increase for each additional hour of study.
This example is simple, but the same logic applies to many real research topics. You only need one predictor variable and one continuous outcome variable.
Dependent and Independent Variables in Simple Linear Regression
Simple linear regression uses two main variables.
The dependent variable is the outcome variable. It is the variable you want to predict or explain.
Examples of dependent variables include:
- Exam score
- Blood pressure
- Sales
- Income
- Customer satisfaction
- Job performance
The independent variable is the predictor variable. It is the variable you use to predict the outcome.
Examples of independent variables include:
- Study hours
- Age
- Advertising budget
- Years of experience
- Job stress
- Training time
A simple way to identify the variables is to ask two questions.
First, ask: What am I trying to predict?
That is the dependent variable.
Second, ask: What am I using to make the prediction?
That is the independent variable.
In simple linear regression, there should be only one independent variable. If you have two or more predictors, you are moving into multiple linear regression.
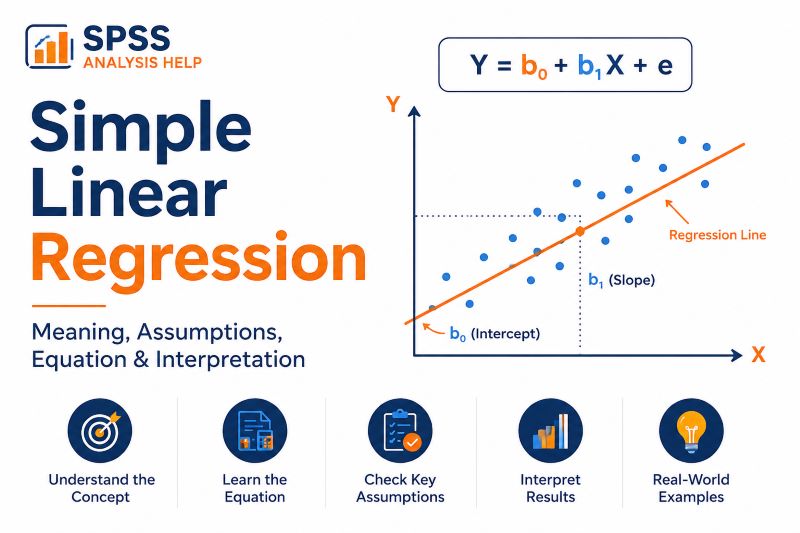
Simple Linear Regression Equation
The simple linear regression equation is usually written as:
Y = b₀ + b₁X + e
Each part of the equation has a meaning.
- Y is the predicted value of the dependent variable.
- b₀ is the intercept. It is the predicted value of Y when X is zero.
- b₁ is the slope or regression coefficient. It shows how much Y is expected to change when X increases by one unit.
- X is the value of the independent variable.
- e is the error term. It represents the difference between the actual value and the predicted value.
Using the study example, the equation may look like this:
Predicted exam score = 48 + 4.5(study hours)
This means the model starts at 48 and adds 4.5 points for each additional hour of study.
What Does the Regression Line Mean?
The regression line is the straight line that best fits the data points.
In a scatterplot, each point represents one case. For example, each point may represent one student, with study hours on the horizontal axis and exam scores on the vertical axis.
The regression line shows the predicted exam score for each number of study hours.
- If the line slopes upward, the relationship is positive. This means higher values of the predictor are linked with higher values of the outcome.
- If the line slopes downward, the relationship is negative. This means higher values of the predictor are linked with lower values of the outcome.
- If the line is almost flat, the predictor may not explain much change in the outcome.
The line does not usually pass through every data point. This is normal. Real data contains variation, so the line represents the best overall prediction.
What Is the Intercept?
The intercept is the predicted value of the dependent variable when the independent variable equals zero.
In the equation Y = b₀ + b₁X + e, the intercept is b₀.
For example, suppose the regression equation is:
Predicted exam score = 48 + 4.5(study hours)
The intercept is 48. This means the model predicts an exam score of 48 when study hours are zero.
However, the intercept is not always meaningful in real life.
Sometimes zero is not a realistic value for the predictor. In other cases, zero may be outside the range of the data. When that happens, the intercept is mainly a mathematical starting point for the regression line.
You should interpret the intercept carefully and focus more on whether it makes sense in your research context.
What Is the Slope?
The slope is one of the most important parts of simple linear regression.
It shows how much the dependent variable is expected to change when the independent variable increases by one unit.
In the equation Y = b₀ + b₁X + e, the slope is b₁.
For example, suppose the slope is 4.5 in a model predicting exam scores from study hours. This means that each additional hour of study is associated with a 4.5-point increase in predicted exam score.
A positive slope means the outcome increases as the predictor increases.
A negative slope means the outcome decreases as the predictor increases.
A slope close to zero means the predictor may not have a strong relationship with the outcome.
When interpreting simple linear regression, the slope usually gives the clearest explanation of the relationship.
What Are Residuals?
A residual is the difference between the actual value and the predicted value.
The formula is:
Residual = actual value − predicted value
For example, suppose a student’s actual exam score is 80. The regression model predicts a score of 75. The residual is:
80 − 75 = 5
This means the model underpredicted the student’s score by 5 points.
If another student’s actual score is 70 and the model predicted 76, the residual is:
70 − 76 = -6
This means the model overpredicted the student’s score by 6 points.
Residuals show prediction error. Smaller residuals mean the regression line is closer to the actual data points.
Residuals are also important because they help you check several regression assumptions, including normality and homoscedasticity.
Assumptions of Simple Linear Regression
Simple linear regression has assumptions that should be checked before trusting the results.
Assumptions are conditions that help the regression model produce reliable estimates. Your data does not need to be perfect, but serious assumption problems can affect your findings.
The main assumptions include:
- The relationship should be linear.
- The observations should be independent.
- The residuals should be approximately normally distributed.
- The residuals should have a constant spread.
- There should be no extreme outliers that distort the model.
These assumptions help you decide whether simple linear regression is suitable for your data.
Many students skip assumption checking because SPSS still produces output even when assumptions are violated. This is a mistake. If the assumptions are badly violated, the regression results may be misleading.
You can learn more about avoiding these issues in our guide on common SPSS analysis mistakes and how to avoid them.
1. Linearity Assumption
The linearity assumption means the relationship between the independent variable and the dependent variable should be roughly straight-line.
This does not mean every point must fall exactly on the line. It only means the general pattern should look linear.
A scatterplot is one of the easiest ways to check linearity.
If the points form an upward or downward straight-line pattern, the linearity assumption may be reasonable.
If the points form a curve, simple linear regression may not be the best method. A curved pattern suggests that the relationship may be nonlinear.
For example, study hours may improve exam scores up to a point, but after too many hours, the benefit may slow down. In that case, the relationship may not be perfectly linear.
Checking linearity before running or interpreting regression helps you avoid using the wrong model.
2. Independence Assumption
The independence assumption means each observation should be independent of the others.
In simple terms, one person’s value should not directly determine another person’s value.
For example, if each row in your dataset represents a different student, the observations may be independent. However, if the same student is measured many times, the observations may not be independent.
This assumption matters because standard regression assumes that each case provides separate information.
Independence problems often appear in repeated measures, paired data, clustered data, and time-series data.
For example, monthly sales figures may be related from one month to the next. In that case, independence may be a concern.
When independence is violated, the model may underestimate or overestimate statistical significance.
The Durbin-Watson statistic is sometimes used to check the independence of errors, especially when the data are ordered or time-related.
3. Normality of Residuals
The normality assumption means the residuals should be approximately normally distributed.
This assumption is often misunderstood. It does not mean the independent variable must be normally distributed. It also does not always mean the dependent variable itself must be perfectly normal.
The main concern is whether the residuals are approximately normal.
Residuals are the prediction errors from the model. If the residuals are strongly non-normal, the p-values and confidence intervals may become less reliable, especially in small samples.
You can check this assumption using a histogram of residuals or a Normal P-P Plot.
A roughly bell-shaped histogram suggests that residuals may be approximately normal.
In a Normal P-P Plot, the points should follow the diagonal line reasonably closely.
Small departures from normality are common. Serious departures may require closer investigation.
4. Homoscedasticity Assumption
Homoscedasticity means the residuals should have a fairly equal spread across the predicted values. In simple language, the prediction errors should be spread out in a similar way across the whole regression line.
You can check this using a scatterplot of standardized residuals against standardized predicted values. If the points appear randomly scattered, the assumption may be reasonable. However, if the points form a funnel shape, the assumption may be violated.
For example, the residuals may be narrow for low predicted values but wider for high predicted values. This means the model predicts some parts of the data better than others.
Homoscedasticity matters because unequal error spread can affect standard errors, confidence intervals, and significance tests. When this assumption is violated, the model may still describe a trend, but the statistical tests may be less trustworthy.
5. Outliers
Outliers are unusual values that sit far away from the rest of the data. In simple linear regression, outliers can strongly affect the regression line.
For example, if most students studied between 1 and 10 hours, but one student reported 60 hours, that value may pull the regression line in an unusual direction.
Not every outlier is wrong. Some outliers are real values. However, every extreme value should be checked.
You should ask:
- Was the value entered correctly?
- Is the value possible?
- Does the value belong to the same population?
- Does the value strongly affect the regression result?
Common tools for checking outliers include scatterplots, standardized residuals, leverage values, and Cook’s distance.
Removing outliers without a valid reason is not good practice. Instead, investigate them and explain how they were handled.
How to Check Simple Linear Regression Assumptions
You can check simple linear regression assumptions using graphs and diagnostic statistics.
- A scatterplot helps you check whether the relationship between the predictor and outcome looks linear.
- A histogram of residuals helps you check whether the residuals are approximately normally distributed.
- A Normal P-P Plot or Q-Q Plot helps you assess whether residuals follow a normal pattern.
- A residual plot helps you check whether the spread of residuals is roughly constant across predicted values.
- Standardized residuals can help identify outliers. Values beyond about ±3 may need closer inspection.
- The Durbin-Watson statistic may be useful when checking independence of errors, especially in ordered or time-related data.
If you want the exact SPSS procedure for generating these outputs, read our guide on how to run simple linear regression in SPSS.
Simple Linear Regression vs Correlation
Simple linear regression and correlation are related, but they are not the same.
Correlation measures the strength and direction of a relationship between two variables. For example, correlation can show whether study hours and exam scores are positively related. However, a simple linear regression goes further. It creates a prediction equation that estimates the value of the dependent variable from the independent variable.
Correlation answers:
How strongly are the two variables related?
Regression answers:
How well does one variable predict the other?
Another difference is direction. In correlation, the two variables are treated more equally. In regression, you must clearly identify the dependent variable and the independent variable.
Both methods can show association, but neither automatically proves causation.
Simple Linear Regression vs Multiple Linear Regression
Simple linear regression uses one independent variable. On the other hand, multiple linear regression uses two or more independent variables.
A simple linear regression example is:
Study hours predicting exam score.
A multiple linear regression example is:
Study hours, class attendance, and motivation predict exam scores.
Multiple regression is useful when an outcome is likely influenced by several factors.
For example, exam performance may not depend only on study hours. It may also depend on attendance, prior knowledge, sleep, teaching quality, and motivation.
Simple linear regression is easier to understand because it focuses on one predictor. However, multiple regression may be more realistic when several variables affect the outcome.
The correct choice depends on your research question, theory, and dataset.
Simple Linear Regression vs Logistic Regression
Simple linear regression is used when the dependent variable is continuous.
A continuous dependent variable has numeric values that can vary across a range.
Examples include:
- Exam score
- Blood pressure
- Income
- Sales
- Satisfaction score
Logistic regression is used when the dependent variable is categorical. The most common type is binary logistic regression, where the outcome has two categories.
Examples include:
- Pass or fail
- Yes or no
- Employed or unemployed
- Disease present or absent
Use simple linear regression when predicting a numeric outcome.
Use logistic regression when predicting category membership or the probability of an event.
Choosing between these methods depends mainly on the type of dependent variable.
How to Interpret Simple Linear Regression Results
Simple linear regression output usually includes several important values.
The most common values are:
- R
- R-square
- F-test
- Regression coefficient
- p-value
- Confidence interval
Each value answers a different question.
- R tells you about the strength of the relationship.
- R-squared tells you how much variation in the dependent variable is explained by the predictor.
- The F-test tells you whether the overall model is statistically significant.
- The regression coefficient tells you how much the outcome changes when the predictor increases by one unit.
- The p-value helps you decide whether the relationship is statistically significant.
You should not interpret only one value. A good interpretation considers model fit, coefficient size, direction, significance, and practical meaning.
What Does R Mean?
R is a measure of the relationship between observed and predicted values.
In simple linear regression, R is closely related to the correlation between the independent variable and the dependent variable. R can range from 0 to 1 when shown as a model summary value. A larger R value suggests a stronger relationship between the predictor and the outcome.
For example, an R value of .80 suggests a stronger relationship than an R value of .25.
However, R alone does not explain how much variance is explained. For that, you look at R-squared. R also does not tell you whether the predictor has practical importance. A relationship can be statistically significant but still too small to matter in real life.
That is why R should be interpreted together with R-square, the coefficient, and the research context.
What Does R-Square Mean?
R-square shows the proportion of variation in the dependent variable explained by the independent variable. For example, if R-square is .36, this means the predictor explains 36% of the variation in the outcome.
Using the study hours example, an R-square of .36 means that the study hours explain 36% of the variation in exam scores. The remaining 64% is explained by other factors or random variation not included in the model.
R-square is useful because it shows how much explanatory power the model has.
A higher R-square means the predictor explains more variation in the outcome. However, a high R-square is not always required. In social science and education research, human behavior is often influenced by many factors, so modest R-square values can still be meaningful.
Always interpret R-squared in the context of the research topic.
What Does the F-Test Mean?
The F-test checks whether the overall regression model is statistically significant.
In simple linear regression, the F-test tells you whether the independent variable improves the prediction of the dependent variable compared with a model that has no predictor.
The key value is usually the p-value linked to the F-test.
If the p-value is less than your chosen significance level, such as .05, the model is usually considered statistically significant.
This means the predictor has a statistically significant relationship with the outcome.
For example, if study hours significantly predict exam scores, the F-test may show a p-value less than .05.
However, the F-test does not tell you the exact slope or direction of the relationship. For that, you need the regression coefficient.
What Does the Regression Coefficient Mean?
The regression coefficient shows how much the dependent variable is expected to change when the independent variable increases by one unit.
This coefficient is often called the slope.
For example, suppose the coefficient for study hours is 4.5. This means each additional hour of study is associated with a 4.5-point increase in predicted exam score.
- If the coefficient is positive, the relationship is positive.
- If the coefficient is negative, the relationship is negative.
- If the coefficient is close to zero, the predictor may have little relationship with the outcome.
The coefficient should always be interpreted using the unit of measurement.
For example, a one-unit increase may mean one hour, one year, one dollar, one point, or one scale unit. The meaning depends on how the variable was measured.
What Does the P-Value Mean?
The p-value helps you decide whether the regression relationship is statistically significant.
A common rule is to compare the p-value with a significance level such as .05.
If the p-value is less than .05, the predictor is usually considered statistically significant.
If the p-value is greater than .05, there may not be enough evidence to conclude that the predictor significantly predicts the outcome.
However, the p-value should not be the only thing you report or interpret.
A small p-value does not automatically mean the effect is large or important. It only suggests that the result is unlikely to have occurred by random chance under the null hypothesis.
You should also consider the coefficient, R-square, confidence interval, sample size, and practical meaning.
How to Interpret a Positive Regression Coefficient
A positive regression coefficient means the dependent variable increases as the independent variable increases.
For example, suppose study hours have a positive coefficient when predicting exam scores.
This means students who study more hours are predicted to score higher.
A simple interpretation may be:
For every one-hour increase in study time, the predicted exam score increases by 4.5 points.
This statement is clear because it explains the predictor, the outcome, the unit of change, and the direction of the relationship.
Positive coefficients are common when the predictor is expected to improve the outcome.
Examples include:
- Training hours predicting job performance
- Advertising spending predicting sales
- Study hours predicting exam scores
Always check whether the direction makes sense based on your variable coding and research question.
How to Interpret a Negative Regression Coefficient
A negative regression coefficient means the dependent variable decreases as the independent variable increases.
For example, suppose job stress has a negative coefficient when predicting job satisfaction.
This means higher job stress is associated with lower predicted job satisfaction.
A simple interpretation may be:
For every one-point increase in job stress, predicted job satisfaction decreases by 2.3 points.
Negative coefficients are common when the predictor is expected to reduce the outcome.
Examples include:
- Stress predicting satisfaction
- Absenteeism predicting performance
- Price predicting demand
- Waiting time predicting customer satisfaction
When interpreting a negative coefficient, be careful with how the variables are coded. Some scales are coded so that higher values mean more of the concept, while others may be reversed.
Can Simple Linear Regression Prove Cause and Effect?
Simple linear regression does not automatically prove cause and effect. It can show whether one variable predicts another variable. However, prediction is not the same as causation.
For example, study hours may predict exam scores. But this does not prove that study hours are the only cause of exam performance.
Other factors may also matter, such as:
- Prior knowledge
- Teaching quality
- Motivation
- Sleep
- Attendance
- Test anxiety
Causal claims depend on research design, theory, measurement, and control of confounding variables.
Experiments provide stronger evidence for causation because the researcher controls the conditions. Observational studies are usually weaker for causal claims because many outside factors may affect the result.
A safe interpretation is to say that one variable predicts or is associated with another variable unless your study design supports causal language.
Simple Linear Regression Example With Interpretation
Suppose a researcher examines whether study hours predict exam scores.
The regression output shows:
- Intercept = 48.00
- Slope = 4.50
- R-square = .52
- p-value = .001
The regression equation is:
Predicted exam score = 48.00 + 4.50(study hours)
This means that when study hours are zero, the predicted exam score is 48.00. For each additional hour of study, the predicted exam score increases by 4.50 points.
The R-square value is .52. This means study hours explain 52% of the variation in exam scores.
The p-value is .001. Since this is less than .05, study hours significantly predict exam scores.
In simple language, students who study for more hours tend to have higher predicted exam scores.
This example shows how the equation, coefficient, R-square, and p-value work together.
When Simple Linear Regression May Not Be Appropriate
Simple linear regression is not always the right method.
It may not be appropriate when the dependent variable is categorical. For example, if the outcome is pass or fail, logistic regression may be better.
It may also be unsuitable when the relationship is clearly curved. A straight-line model may not describe a curved relationship well.
Simple linear regression may also be weak when there are extreme outliers. Outliers can pull the line and change the results.
It may not work well when observations are not independent, such as repeated measurements from the same person.
It may also be too simple when the outcome is influenced by several predictors. In that case, multiple regression may be more suitable.
If your research question is about comparing group means, you may need a t-test or ANOVA instead.
The best method depends on your research question, variables, study design, and assumptions.
Getting Help With Simple Linear Regression
Simple linear regression is easy to run in software, but it still requires careful thinking.
You must choose the correct variables, check assumptions, interpret the coefficient correctly, and explain what the model means.
Many students also need help deciding whether simple linear regression is the right method for their research question.
At SPSSAnalysisHelp.com, we support students and researchers with SPSS data analysis help, SPSS assignment help, and SPSS help for students. However, if your regression analysis is part of a thesis or dissertation, you may also need dissertation statistics help or dissertation data analysis help.
These services can help with test selection, data analysis, assumption checking, output interpretation, and results explanation.
Final Thoughts
Simple linear regression is used to predict one continuous dependent variable from one independent variable.
It helps you understand whether a predictor is related to an outcome and how much the outcome is expected to change when the predictor increases.
The main parts of simple linear regression are the dependent variable, independent variable, regression equation, intercept, slope, residuals, R-square, and p-value.
Before trusting the results, you should check the key assumptions. These include linearity, independence, normality of residuals, homoscedasticity, and outliers.
You should also remember that regression does not automatically prove causation. It shows prediction or association unless the research design supports a causal claim.
After learning the concept, the next step is to run the analysis correctly in SPSS and then learn how to report the findings clearly.
Frequently Asked Questions
Simple linear regression is a statistical method used to predict one dependent variable from one independent variable. It uses a straight-line model to describe the relationship between the two variables.
Use simple linear regression when you want to predict one continuous outcome variable from one predictor variable. For example, you may use it to test whether study hours predict exam scores.
The dependent variable is the outcome you want to predict. Examples include exam score, income, blood pressure, sales, and satisfaction score.
The independent variable is the predictor used to explain or predict the dependent variable. Examples include study hours, age, advertising spending, job stress, and years of experience.
The common equation is Y = b₀ + b₁X + e. Y is the predicted outcome, b₀ is the intercept, b₁ is the slope, X is the predictor, and e is the error term.
R-squared shows the proportion of variation in the dependent variable explained by the independent variable. For example, an R-square of .40 means the predictor explains 40% of the variation in the outcome.
No. Simple linear regression does not automatically prove causation. It can show prediction or association, but causal claims require a suitable research design and strong theoretical support.