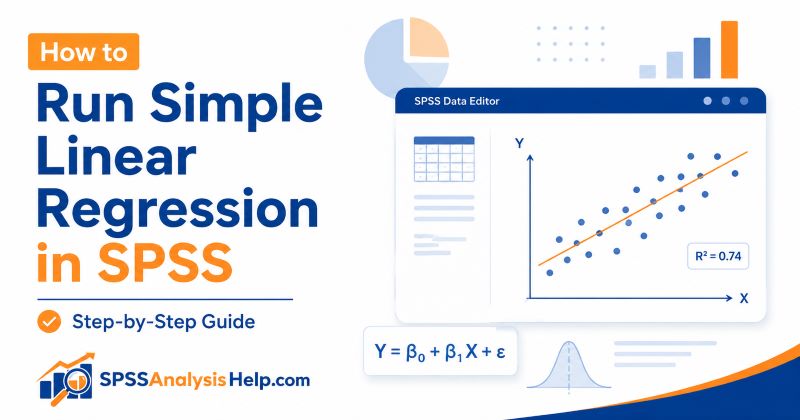
Simple linear regression is one of the most common statistical tests used in SPSS. It helps you examine whether one variable can predict another variable.
For example, a student may want to know whether study hours predict exam scores. A business researcher may want to know whether advertising spending predicts sales. A health researcher may want to know whether age predicts blood pressure.
SPSS makes the analysis easy to run. However, many beginners still struggle with where to click, which variable goes into each box, and which output tables they should focus on after running the model.
This guide explains how to run a simple linear regression in SPSS step by step. The focus is on the SPSS procedure. You will learn how to prepare your variables, create a scatterplot, open the regression dialog box, select the right options, run the analysis, and identify the most important output tables.
Want to learn how to report the simple linear regression SPSS outputs in APA? Check out the complete guide on reporting simple linear regression SPSS outputs in APA
What Is Simple Linear Regression in SPSS?
Simple linear regression is a statistical method used to predict one continuous outcome variable from one predictor variable.
It is called “simple” because it uses only one independent variable. It is called “linear” because the method tries to fit a straight line through the data points.
A simple example is:
Does study time predict exam performance?
In this example, study time is the predictor variable. Exam performance is the outcome variable.
In SPSS, simple linear regression is found under the Linear Regression procedure. The same SPSS menu can also be used for multiple regression. The difference is that simple linear regression includes only one predictor, while multiple regression includes two or more predictors.
This article focuses only on the simple linear regression procedure in SPSS. Want to learn more about simple linear regression, including its assumptions? Read the simple linear regression guide.
When Should You Run Simple Linear Regression in SPSS?
You should run a simple linear regression when your goal is to predict one dependent variable using one independent variable.
The dependent variable is the outcome you want to predict. On the other hand, the independent variable is the predictor you believe may explain changes in the outcome.
You may use simple linear regression when asking questions such as:
- Do study hours predict exam scores?
- Does income predict monthly spending?
- Does age predict blood pressure?
- Does job stress predict job satisfaction?
- Does advertising budget predict sales?
Simple linear regression is useful when your research question focuses on prediction. If your aim is only to measure the strength and direction of a relationship, correlation may be enough. If your aim is to predict an outcome using more than one predictor, you may need multiple linear regression instead.
What You Need Before Running Simple Linear Regression
Before you open the regression dialog box in SPSS, you need to identify your variables correctly.
For simple linear regression, you need:
- One dependent variable
- One independent variable
The dependent variable is the outcome variable. It is the variable you want to explain or predict.
The independent variable is the predictor variable. It is the variable you think may influence, explain, or predict the dependent variable.
For this guide, we will use the following example:
A researcher wants to know whether study hours predict exam scores among students.
In this example:
- Dependent variable: exam score
- Independent variable: study hours
This means we are asking whether students who study for more hours tend to have higher exam scores.
Step 1: Open Your Dataset in SPSS
Start by opening your dataset in SPSS.
Your data should be arranged properly before you run the analysis. In SPSS Data View, each row should represent one case. A case may be one student, one participant, one respondent, one customer, or one observation.
Each column should represent one variable.
For example, if you are analyzing students, each row should represent one student. The study hours variable should be in one column, and the exam score variable should be in another column.
A simple layout may look like this:
| Student | Study Hours | Exam Score |
|---|---|---|
| 1 | 3 | 62 |
| 2 | 5 | 71 |
| 3 | 8 | 84 |
| 4 | 2 | 55 |
This structure helps SPSS understand which values belong to each case.
Step 2: Check Your Variable Names
After opening the dataset, click Variable View at the bottom of SPSS.
Check whether your variable names are clear. Variable names should help you identify what each column represents.
For example, instead of using unclear names such as Var0001 or Var0002, use names such as:
- study_hours
- exam_score
- age
- income
- satisfaction
Clear variable names reduce confusion when you move variables into the regression dialog box.
You should also check the variable labels if your dataset uses short names. A variable name may be short, but the label can give a fuller description.
For example:
- Variable name: study_hours
- Variable label: Number of hours spent studying per week
This is useful when your SPSS output displays labels instead of variable names.
Step 3: Check the Measurement Level
Still in Variable View, check the Measure column.
For simple linear regression, the dependent variable should usually be measured at the scale level. The independent variable is also commonly scale-level in basic simple linear regression.
In our example:
- study_hours should be Scale
- exam_score should be Scale
SPSS measurement levels include Nominal, Ordinal, and Scale. Scale is used for continuous numeric variables, such as scores, income, age, time, weight, or height.
This does not mean every regression problem is impossible with categorical predictors. However, categorical predictors may require dummy coding or a different setup. Since this article focuses on a beginner-friendly simple linear regression procedure, we will use one scale-dependent variable and one scale-independent variable.
If you are unsure whether your variables are suitable for regression, you may need broader SPSS data analysis help before running the model.
Step 4: Create a Scatterplot Before Running Regression
Before running simple linear regression, it is good practice to create a scatterplot.
A scatterplot helps you see the relationship between the independent variable and the dependent variable. It also helps you check whether the relationship looks roughly linear.
To create a scatterplot in SPSS:
- Click Graphs.
- Click Chart Builder.
- Select Scatter/Dot.
- Drag the simple scatterplot option into the preview area.
- Move the independent variable to the X-axis.
- Move the dependent variable to the Y-axis.
- Click OK.
For our example:
- X-axis: study hours
- Y-axis: exam score
This means study hours should appear along the horizontal axis, while exam score should appear along the vertical axis.
Step 5: Review the Scatterplot
After SPSS creates the scatterplot, look at the general pattern of the points.
- If the points rise from left to right, the relationship may be positive. This means higher values of the independent variable are linked with higher values of the dependent variable.
- If the points fall from left to right, the relationship may be negative. This means higher values of the independent variable are linked with lower values of the dependent variable.
- If the points show no clear pattern, the relationship may be weak.
- If the points form a curve, simple linear regression may not be the best method because the relationship may not be linear.
You should also look for extreme points that sit far away from the rest of the data. These may be outliers. Outliers can affect the regression line and should be checked carefully.
Step 6: Open the Linear Regression Dialog Box
Once you have checked your variables and reviewed the scatterplot, you can run the regression.
In SPSS, go to:
Analyze → Regression → Linear
This opens the Linear Regression dialog box.
The Linear Regression dialog box is where you tell SPSS which variable is the outcome and which variable is the predictor.
Do not worry if the dialog box looks detailed. For a simple linear regression, you only need to focus on a few important areas:
- Dependent box
- Independent(s) box
- Method
- Statistics
- Plots
- Save, if needed
The most important step is placing the correct variables in the correct boxes.
Step 7: Move the Dependent Variable Into the Dependent Box
The dependent variable is the outcome variable. It is the variable you want to predict.
In our example, the researcher wants to predict exam scores. Therefore, exam score is the dependent variable.
To set this in SPSS:
- Select exam_score from the variable list.
- Click the arrow next to the Dependent box.
- Make sure exam_score appears in the Dependent box.
A simple way to remember this is to ask:
What am I trying to predict?
The answer goes into the Dependent box.
If you place the wrong variable in this box, SPSS will still run the model, but the result will answer the wrong question.
Step 8: Move the Independent Variable Into the Independent(s) Box
The independent variable is the predictor variable.
In our example, study hours is the predictor because we want to know whether study hours predict exam scores.
To set this in SPSS:
- Select study_hours from the variable list.
- Click the arrow next to the Independent(s) box.
- Make sure study_hours appears in the Independent(s) box.
Even though SPSS labels the box as Independent(s), simple linear regression should include only one independent variable.
If you add two or more predictors, you are no longer running a simple linear regression. You are running multiple linear regression.
This distinction matters because the interpretation changes when you add more predictors to the model.
Step 9: Keep the Method as Enter
In the Linear Regression dialog box, you will see a section labeled Method.
For a simple linear regression, keep the method as:
Enter
This is the default option in SPSS.
The Enter method tells SPSS to include the predictor in the model directly. Since simple linear regression has only one independent variable, this is the appropriate and simplest method for most beginner analyses.
You may see other methods such as Stepwise, Forward, Backward, or Remove. These methods are used in more advanced regression procedures and should not be selected unless your study design specifically requires them.
For this guide, leave the method as Enter and continue with the next step.
Step 10: Select Statistics Options
Next, click the Statistics button in the Linear Regression dialog box.
SPSS will open another window with several options. For a basic simple linear regression, you can select the following:
- Estimates
- Model fit
- Confidence intervals
- Descriptives
- Durbin-Watson, if relevant
Estimates gives you the coefficients table. This table shows the constant and the slope for the predictor.
Model fit gives you the model summary and ANOVA table. These tables help you assess how well the model performs.
Confidence intervals give lower and upper bounds for the regression coefficient.
Descriptives provide means and standard deviations for your variables.
Durbin-Watson may be useful when checking whether residuals are independent, especially in ordered or time-related data.
After selecting the options you need, click Continue.
Step 11: Select Plots for Residual Checking
After returning to the main Linear Regression dialog box, click Plots.
This section helps you request plots that are useful when checking regression assumptions.
Use the following setup:
- Move ZPRED to the X box.
- Move ZRESID to the Y box.
- Select Histogram.
- Select Normal probability plot.
- Click Continue.
ZPRED represents standardized predicted values. ZRESID represents standardized residuals.
The scatterplot of ZPRED and ZRESID can help you check whether the residuals are evenly spread. The histogram and Normal P-P Plot can help you inspect whether residuals are approximately normal.
This article does not go deeply into assumption interpretation. However, selecting these plots at this stage saves time because SPSS will generate them together with the regression output.
Step 12: Save Predicted Values and Residuals If Needed
This step is optional.
In the Linear Regression dialog box, click Save if you want SPSS to create new variables in your dataset.
Useful options include:
- Unstandardized predicted values
- Standardized predicted values
- Unstandardized residuals
- Standardized residuals
Predicted values are the values estimated by the regression model. Residuals are the differences between the observed values and the predicted values.
Saving these values can help if you want to inspect outliers, create additional plots, or conduct further diagnostic checks.
For many beginner assignments, you may not need to save these values. However, for dissertation or thesis analysis, saving residuals can be helpful because it gives you more control when checking the model.
If you do not need this option, you can skip it.
Step 13: Run the Simple Linear Regression
After setting your dependent variable, independent variable, statistics options, and plots, click OK.
SPSS will run the regression and open the Output Viewer.
The output may look long, especially if you selected descriptive statistics, plots, and residual checks. Do not panic. You do not need every table with the same level of detail.
For a simple linear regression, the most important output sections are usually:
- Descriptive Statistics
- Correlations
- Variables Entered/Removed
- Model Summary
- ANOVA
- Coefficients
- Residual plots
The next sections explain what each output section is for. This is not a full interpretation guide. It is a quick guide to help you know where to look after running the analysis.
Descriptive Statistics Table
The Descriptive Statistics table shows the mean, standard deviation, and sample size for each variable included in the model.
For our example, this table would summarize study hours and exam scores.
This table is useful because it helps you understand your data before focusing on the regression model. It tells you the average score, how much variation exists, and how many valid cases were included.
You may use this table when writing the descriptive part of your results section.
However, the Descriptive Statistics table does not tell you whether the predictor significantly predicts the outcome. For that, you need to look at the regression output tables, especially the Model Summary, ANOVA, and Coefficients tables.
Correlations Table
The Correlations table shows the relationship between the dependent variable and the independent variable.
In a simple linear regression, this table can help you see whether the two variables are positively or negatively related.
For example, if study hours and exam scores have a positive correlation, students who study more tend to have higher exam scores.
However, correlation is not the same as regression. Correlation describes the strength and direction of a relationship. Regression goes further by estimating a prediction model.
This table is useful background information, but it is not the main table for writing your regression results.
For the main regression result, focus on the Model Summary, ANOVA, and Coefficients tables.
Variables Entered/Removed Table
The Variables Entered/Removed table shows which predictor was included in the model.
For simple linear regression, this table should show only one independent variable.
In our example, it should show that study_hours was entered into the model.
This table is usually not the most important table for interpretation, but it helps you confirm that SPSS ran the model using the correct predictor.
If the wrong variable appears here, it means you may have selected the wrong independent variable. In that case, you should go back and rerun the analysis.
This table also shows the method used. For this guide, the method should be Enter.
Model Summary Table
The Model Summary table is one of the most important SPSS output tables for regression.
This table usually includes:
- R
- R Square
- Adjusted R Square
- Standard Error of the Estimate
- Durbin-Watson, if selected
R shows the strength of the relationship between the observed and predicted values.
R Square shows the proportion of variation in the dependent variable explained by the independent variable.
For example, if R Square is .40, this means the predictor explains 40% of the variation in the outcome variable.
The Model Summary table gives you a quick view of how much explanatory power your model has.
A deeper explanation of R Square and Adjusted R Square should be covered in your separate interpretation article.
ANOVA Table
The ANOVA table tells you whether the overall regression model is statistically significant.
In this table, the main value beginners often look for is the Sig. value.
If the Sig. value is less than your chosen significance level, such as .05, the model is usually considered statistically significant.
This means the independent variable significantly predicts the dependent variable.
In our example, a significant ANOVA table would suggest that study hours significantly predict exam scores.
However, the ANOVA table does not tell you the exact regression equation. It also does not tell you the size or direction of the predictor’s effect. For that, you need the Coefficients table.
Coefficients Table
The Coefficients table is another key table in simple linear regression.
This table gives you the values needed to write the regression equation.
It usually includes:
- Constant
- Unstandardized B
- Standard Error
- Standardized Beta
- t value
- Sig. value
- Confidence interval, if selected
The Constant row gives the intercept. The predictor row gives the slope.
In our example, the predictor row for study_hours tells you how much the predicted exam score changes when study hours increase by one unit.
The Coefficients table is also where you check whether the independent variable is statistically significant.
A full explanation of the coefficient, slope, t value, p value, and regression equation should be handled in a separate article on interpreting simple linear regression output.
Residual Plots
If you selected plots, SPSS will also produce residual plots.
These plots help you check whether the regression model meets important assumptions.
The histogram of residuals helps you see whether residuals are approximately normally distributed.
The Normal P-P Plot helps you check whether the residuals follow a normal pattern.
The scatterplot of standardized predicted values and standardized residuals helps you inspect whether residuals are evenly spread.
At this stage, your main goal is to confirm that the plots do not show serious problems. If the plots show a strong curve, funnel shape, or extreme outliers, you may need to investigate further before reporting the results.
For more general SPSS workflow guidance, you can also read SPSS Tips & Best Practices: Smart Ways to Work Faster.
SPSS Syntax for Simple Linear Regression
SPSS also allows you to run simple linear regression using syntax.
Syntax is useful because it records the exact commands used for the analysis. This can help when you want to repeat the analysis, document your work, or share your procedure with a supervisor.
Here is an example:
REGRESSION
  /DESCRIPTIVES MEAN STDDEV CORR SIG N
  /MISSING LISTWISE
  /STATISTICS COEFF OUTS CI(95) R ANOVA
  /DEPENDENT exam_score
  /METHOD=ENTER study_hours.
In this example, exam_score is the dependent variable and study_hours is the independent variable.
You should replace these names with the actual variable names in your dataset.
If your variable names are different, the syntax will not run until you update them correctly.
Syntax is not required for beginners, but it is a good habit when working on serious research projects.
Quick Checklist Before You Interpret the Results
Before interpreting your SPSS output, use this checklist:
- Did you open the correct dataset?
- Did you identify the dependent variable correctly?
- Did you identify the independent variable correctly?
- Did you place the outcome variable in the Dependent box?
- Did you place only one predictor in the Independent(s) box?
- Did you keep the method as Enter?
- Did you select Estimates and Model fit?
- Did you create or review a scatterplot?
- Did you request residual plots if needed?
- Did SPSS produce the Model Summary, ANOVA, and Coefficients tables?
If your answer is yes to these questions, you are ready to move to interpretation.
This is where you examine whether the model is significant, how much variance is explained, and what the regression coefficient means.
Common Mistakes When Running Simple Linear Regression in SPSS
Many beginners make mistakes before they even interpret the output. Some of these mistakes include:
- Placing variables in the wrong boxes. The dependent variable should go into the Dependent box. The independent variable should go into the Independent(s) box.
- Adding several predictors while still calling the analysis simple linear regression. If you add more than one predictor, the analysis becomes multiple regression.
- Some students also skip the scatterplot. This is risky because simple linear regression assumes that the relationship between the variables is roughly linear.
- Running the test without checking whether the variables are appropriate. For example, using a categorical outcome variable in standard linear regression can lead to incorrect analysis.
You can read more about similar issues in 7 Common SPSS Analysis Mistakes and How to Avoid Them.
What to Do After Running the Regression
After running the simple linear regression in SPSS, the next step is interpretation.
You will need to answer questions such as:
- Is the overall model statistically significant?
- How much variance does the predictor explain?
- Is the predictor statistically significant?
- What is the regression equation?
- What does the slope mean in simple language?
- Do the residual plots show any serious assumption problems?
- How should the result be reported in APA style?
These questions go beyond simply running the SPSS procedure.
Want to learn how to report the simple linear regression SPSS outputs in APA? Check out our complete guide on how to report simple linear regression from SPSS in APA
Getting Help With Simple Linear Regression in SPSS
Simple linear regression can look easy in SPSS, but the analysis still requires care. You must choose the correct variables, check the data, run the right procedure, and understand which output tables matter.
If you are working on an assignment, thesis, dissertation, or research project, you may also need help connecting the SPSS output to your research questions.
At SPSSAnalysisHelp.com, students and researchers can get support with SPSS data analysis help, SPSS assignment help, and SPSS help for students. However, if you are working on a larger research project, you may also find dissertation statistics help or dissertation data analysis help useful.
You can also read our guide on how to analyze dissertation data using SPSS if your regression analysis is part of a dissertation or thesis.
Final Thoughts
Running a simple linear regression in SPSS is not difficult once you understand the correct steps.
First, identify your dependent and independent variables. Then check your data structure in SPSS. Create a scatterplot to review the relationship between the two variables. After that, open the Linear Regression dialog box through Analyze, Regression, and Linear.
Move the outcome variable into the Dependent box and the predictor into the Independent(s) box. Keep the method as Enter, choose useful statistics options, request plots if needed, and click OK.
After SPSS produces the output, focus on the Model Summary, ANOVA, and Coefficients tables.
This article has shown you how to run the analysis. The next step is learning how to interpret the output correctly and report the results clearly.
Frequently Asked Questions
Simple linear regression is found under Analyze → Regression → Linear. This opens the Linear Regression dialog box, where you can select your dependent and independent variables.
The outcome variable goes in the Dependent box. This is the variable you want to predict or explain.
The predictor variable goes in the Independent(s) box. In simple linear regression, you should place only one predictor in this box.
Not in simple linear regression. If you use more than one independent variable, you are running multiple linear regression.
Yes. A scatterplot helps you check whether the relationship between the independent and dependent variables looks roughly linear.
SPSS does not write the equation in sentence form, but it gives you the values you need. The Coefficients table provides the constant and slope used to write the regression equation.