
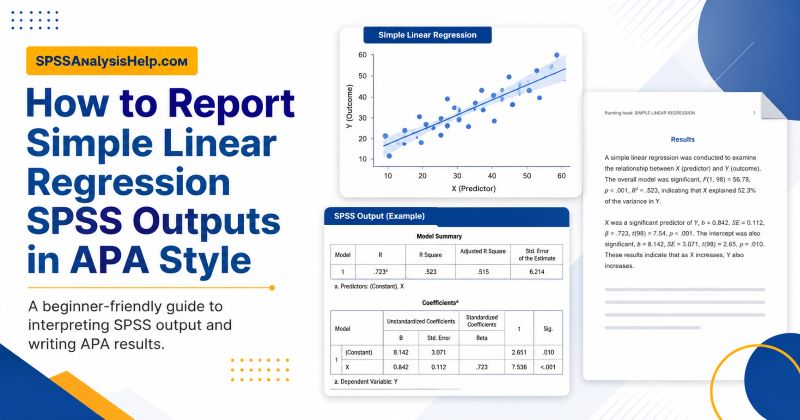
Many students can run simple linear regression in SPSS, but they get stuck when it is time to write the results. The output contains several tables, numbers, and significance values. However, APA reporting does not require you to copy everything from SPSS. You only need to select the right values, format them correctly, and explain what they mean in simple academic language. This guide explains how to report simple linear regression SPSS outputs in APA style. You will learn which SPSS tables to use, what values to report, how to write the regression equation, and how to present both significant and non-significant results.
However, if you have not yet run the analysis, start with our step-by-step guide on how to run simple linear regression in SPSS.
What Simple Linear Regression APA Reporting Means
Simple linear regression is used when you want to know whether one predictor variable predicts one continuous outcome variable.
For example, you may want to know whether study hours predict exam scores. You may also want to know whether advertising spending predicts sales, or whether stress predicts job satisfaction.
APA reporting means writing the result in a clear format that readers can understand. It is not the same as copying the full SPSS output into your assignment, thesis, dissertation, or research report.
A good simple linear regression report usually includes:
- The purpose of the analysis
- The predictor variable
- The outcome variable
- The overall model result
- The amount of variance explained
- The regression coefficient
- The statistical significance
- A short interpretation
Your goal is to answer one main question: did the predictor significantly predict the outcome?
Want to learn more about simple linear regression, including its assumptions? Read our complete guide on simple linear regression.
Which SPSS Output Tables Do You Need?
SPSS gives several output tables after you run a simple linear regression. For APA reporting, the most important ones are the Model Summary table, ANOVA table, and Coefficients table.
The Model Summary table gives the R value, R Square, Adjusted R Square, and Standard Error of the Estimate. The most useful value for reporting is usually R Square because it tells you how much variance in the outcome is explained by the predictor.
The ANOVA table tells you whether the overall regression model is statistically significant. This is where you find the F value, degrees of freedom, and Sig. value.
The Coefficients table gives the intercept, slope, standard error, standardized beta, t value, and p value. This table helps you explain the effect of the predictor and write the regression equation.
You may also use confidence intervals if your instructor, supervisor, or journal requires them.
What to Report From Each SPSS Table
You do not need every number shown in the SPSS output. APA reporting focuses on the values that help the reader understand the model and the predictor.
| SPSS output table | Value to report | Why it matters |
|---|---|---|
| Model Summary | R Square | Shows the variance explained by the model |
| ANOVA | F value | Tests whether the model is significant |
| ANOVA | Degrees of freedom | Shows the model and residual degrees of freedom |
| ANOVA | Sig. value | Reported as the p value |
| Coefficients | B | Shows the unstandardized slope |
| Coefficients | SE B | Shows the standard error of the coefficient |
| Coefficients | Beta | Shows the standardized coefficient |
| Coefficients | t value | Tests the predictor coefficient |
| Coefficients | Sig. value | Shows whether the predictor is significant |
| Coefficients | Constant and B | Used to write the regression equation |
This table shows the path from SPSS output to APA reporting. You read the values from SPSS, then convert them into a clean results paragraph.
Basic APA Format for Simple Linear Regression
A simple linear regression APA report follows a clear pattern. You first state what analysis was conducted. Then you report the overall model. After that, you report the predictor effect.
A basic format is:
A simple linear regression was conducted to determine whether [predictor] predicted [outcome]. The model was statistically significant, F(df1, df2) = value, p = value, and explained percentage% of the variance in [outcome], R² = value. The predictor was a significant predictor of [outcome], B = value, SE = value, β = value, t(df) = value, p = value.
You can adjust this depending on your assignment requirements. Some instructors may ask for the regression equation. Others may ask for a table. In many cases, a short paragraph and a clean APA-style table are enough.
Always explain the result after reporting the statistics.
How to Report a Significant Simple Linear Regression Result in APA
When the regression result is significant, you should report that the predictor significantly predicted the outcome. You should also explain the direction of the relationship.
Here is a simple APA template:
A simple linear regression was conducted to determine whether [predictor] predicted [outcome]. The regression model was statistically significant, F(df1, df2) = value, p = value, and explained percentage% of the variance in [outcome], R² = value. [Predictor] significantly predicted [outcome], B = value, SE = value, β = value, t(df) = value, p = value.
Here is an example:
A simple linear regression was conducted to determine whether study hours predicted exam scores. The regression model was statistically significant, F(1, 58) = 42.00, p < .001, and explained 42% of the variance in exam scores, R² = .42. Study hours significantly predicted exam scores, B = 4.25, SE = 0.66, β = .65, t(58) = 6.48, p < .001.
This means students who studied for more hours tended to have higher exam scores.
How to Report a Non-Significant Simple Linear Regression Result in APA
A non-significant result should still be reported clearly. Do not ignore it because the p value is above .05.
You should say that the predictor did not significantly predict the outcome. However, avoid saying that there was “no effect” unless you have stronger evidence to support that claim.
Here is a useful template:
A simple linear regression was conducted to determine whether [predictor] predicted [outcome]. The regression model was not statistically significant, F(df1, df2) = value, p = value, and explained percentage% of the variance in [outcome], R² = value. [Predictor] did not significantly predict [outcome], B = value, SE = value, β = value, t(df) = value, p = value.
Example:
A simple linear regression was conducted to determine whether social media use predicted exam scores. The regression model was not statistically significant, F(1, 48) = 1.42, p = .239, and explained 3% of the variance in exam scores, R² = .03. Social media use did not significantly predict exam scores, B = -0.18, SE = 0.15, β = -.17, t(48) = -1.19, p = .239.
How to Report R-Squared From SPSS in APA
R Square appears in the Model Summary table. It tells you how much variance in the dependent variable is explained by the independent variable.
For example, if SPSS gives R Square as .42, you can say that the model explained 42% of the variance in the outcome.
To convert R Square into a percentage, multiply it by 100.
R Square = .42. Thus, 0.42 × 100 = 42%
In APA style, you can report this as:
The model explained 42% of the variance in exam scores, R² = .42.
Do not confuse R with R Square. R is the correlation between the observed and predicted values. R Square is the proportion of variance explained by the model.
In simple linear regression, R Square is one of the most important values because it shows how useful the predictor is for explaining the outcome.
How to Report the ANOVA Table in APA
The ANOVA table tells you whether the overall regression model is statistically significant.
In SPSS, look at the Regression row in the ANOVA table. You need the F value, the regression degrees of freedom, the residual degrees of freedom, and the Sig. value.
APA format usually looks like this: F(1, 58) = 42.00, p < .001
The first number in the parentheses is the regression degrees of freedom. In simple linear regression, this is usually 1 because there is one predictor.
The second number is the residual degrees of freedom. This depends on the sample size.
Do not write “Sig. = .032” in your report. SPSS uses the label Sig., but APA reporting uses p.
Also, if SPSS reports the Sig. value as .000, do not write p = .000. Instead, write p < .001.
How to Report the Coefficients Table in APA
The Coefficients table tells you whether the predictor is significant and how the predictor relates to the outcome.
The most important row is the row for your independent variable. The Constant row is mainly used when writing the regression equation.
From the predictor row, you may report:
- B
- Standard Error
- Beta
- t value
- p value
- Confidence interval, if required
The unstandardized B tells you how much the dependent variable is expected to change when the independent variable increases by one unit.
For example, if B = 4.25 for study hours, the predicted exam score increases by 4.25 points for each additional hour of study.
A positive B means the outcome increases as the predictor increases. A negative B means the outcome decreases as the predictor increases.
The standardized beta helps describe the strength and direction of the relationship in standard deviation units.
Should You Report B or Beta?
Many students are unsure whether to report B or beta. In most simple linear regression reports, it is useful to report both if your assignment allows it.
The unstandardized coefficient, B, is easier to interpret because it uses the original units of measurement. For example, if study hours predict exam scores, B tells you how many exam-score points increase for each extra hour of study.
The standardized coefficient, beta, is useful because it shows the relationship in standardized units. This can help readers understand the strength and direction of the predictor.
If you must choose one, B is usually more important for interpretation because it gives the real-unit change in the outcome.
A good report may say:
Study hours significantly predicted exam scores, B = 4.25, SE = 0.66, β = .65, t(58) = 6.48, p < .001.
This gives the reader both the real-unit slope and the standardized effect.
How to Write the Regression Equation in APA Style
A regression equation shows how the predicted value of the outcome is calculated.
The basic simple linear regression equation is:
Predicted Y = b₀ + b₁X
In this equation:
- b₀ is the constant or intercept
- b₁ is the unstandardized coefficient for the predictor
- X is the value of the predictor
You get b₀ and b₁ from the Coefficients table in SPSS.
Suppose the Constant is 42.15 and the B value for study hours is 4.25. The equation would be:
Predicted exam score = 42.15 + 4.25(study hours)
This means that a student with zero study hours has a predicted exam score of 42.15. It also means that each extra study hour increases the predicted exam score by 4.25 points.
Only include the equation if it adds value or your instructor requires it.
APA-Style Table for Simple Linear Regression Results
You should not paste the raw SPSS output table directly into your report. SPSS tables are often too large, crowded, and not formatted in APA style.
Instead, create a clean table that includes only the most important values.
Table 1
Simple Linear Regression Predicting Exam Scores From Study Hours
| Predictor | B | SE B | β | t | p |
|---|---|---|---|---|---|
| Constant | 42.15 | 3.20 | — | 13.17 | < .001 |
| Study hours | 4.25 | 0.66 | .65 | 6.48 | < .001 |
Note. R² = .42, F(1, 58) = 42.00, p < .001.
This table is much easier to read than the SPSS output. It also gives the reader the key information needed to understand the model.
Full Example: Reading SPSS Output Values
Let us use a simple example. A researcher wants to know whether study hours predict exam scores among 60 students.
The SPSS Model Summary table shows:
- R = .65
- R Square = .42
- Adjusted R Square = .41
The ANOVA table shows:
- F = 42.00
- Regression df = 1
- Residual df = 58
- Sig. = .000
The Coefficients table shows:
- Constant = 42.15
- Study hours B = 4.25
- SE B = 0.66
- Beta = .65
- t = 6.48
- Sig. = .000
Before writing the APA paragraph, convert Sig. = .000 into p < .001. Also convert R Square into a percentage. Since R Square = .42, the model explains 42% of the variance in exam scores.
Full Example: APA Paragraph
Using the SPSS values above, the final APA paragraph may look like this:
A simple linear regression was conducted to determine whether study hours predicted exam scores. The regression model was statistically significant, F(1, 58) = 42.00, p < .001, and explained 42% of the variance in exam scores, R² = .42. Study hours significantly predicted exam scores, B = 4.25, SE = 0.66, β = .65, t(58) = 6.48, p < .001. The regression equation was: predicted exam score = 42.15 + 4.25(study hours). This means that each additional study hour was associated with a 4.25-point increase in predicted exam score.
This paragraph reports the model, the variance explained, the predictor effect, and the interpretation. It is short, but it gives the reader the key information.
Common Mistakes When Reporting Simple Linear Regression in APA
Many reporting errors happen because students copy SPSS values without thinking about what they mean.
Avoid these common mistakes:
- Copying the full SPSS output instead of creating an APA-style report
- Reporting only the p value
- Confusing R with R Square
- Writing Sig. instead of p
- Reporting p = .000 instead of p < .001
- Forgetting the degrees of freedom for the F statistic
- Ignoring the direction of the coefficient
- Reporting beta without explaining B
- Saying “caused” when the design only supports prediction
- Forgetting to identify the predictor and outcome
- Treating a non-significant result as proof that no relationship exists
A strong report is not just a list of numbers. It explains what the model shows and what the finding means in relation to the research question.
Simple Linear Regression APA Reporting Checklist
Before submitting your regression report, use this checklist.
- Did you state that you used simple linear regression?
- Did you identify the predictor variable?
- Did you identify the outcome variable?
- Did you report the F value?
- Did you include both degrees of freedom for F?
- Did you report the p value correctly?
- Did you report R Square?
- Did you explain the percentage of variance explained?
- Did you report the unstandardized coefficient B?
- Did you report the standard error?
- Did you report beta if required?
- Did you explain whether the predictor was significant?
- Did you explain the direction of the relationship?
- Did you avoid causal language unless your design supports it?
- Did you avoid pasting raw SPSS output?
If you can answer yes to these questions, your APA report is likely clear and complete.
When to Get Help Reporting SPSS Regression Results
Simple linear regression can look easy until you have to explain the SPSS output in academic language. Many students know where to click but struggle with choosing the right values, checking assumptions, and writing the results correctly.
You may need help if you are unsure whether your model is significant, whether your variables are suitable, or how to write the result in APA style.
At SPSSAnalysisHelp.com, we offer SPSS data analysis help for students and researchers who need support with data analysis, output interpretation, and results reporting. If your regression task is part of coursework, you can also explore our SPSS assignment help. However, if you need broader student support with SPSS output, interpretation, and reporting, our SPSS help for students may also be useful.
Is the analysis part of a thesis or dissertation? Our dissertation data analysis services can support you with test selection, SPSS analysis, interpretation, and results write-up.
Final Thoughts
Reporting simple linear regression SPSS outputs in APA style becomes easier when you know which values matter. You do not need to report every number in the SPSS output. Focus on the Model Summary, ANOVA, and Coefficients tables.
A complete report should explain the overall model, the variance explained, the predictor effect, and the practical meaning of the finding. You should also report p values correctly, avoid copying raw SPSS tables, and use cautious language when discussing prediction.
Once you understand the path from SPSS output to APA wording, simple linear regression reporting becomes much more manageable.
Frequently Asked Questions
Report the purpose of the analysis, the predictor, the outcome, the model result, R Square, F value, degrees of freedom, p value, and predictor coefficient. You should also explain what the result means in simple language.
The F value is found in the ANOVA table. Use the Regression row to report the F statistic, model degrees of freedom, residual degrees of freedom, and p value.
R Square is found in the Model Summary table. It shows the proportion of variance in the dependent variable explained by the independent variable.
You should usually report B because it gives the real-unit change in the dependent variable. You may also report beta because it shows the standardized relationship between the predictor and outcome.
Do not report p = .000. If SPSS shows .000, report it as p < .001. This is because the p value is very small, not exactly zero.
You should include the regression equation if your instructor, supervisor, or journal asks for it. It is also useful when you want to show how predicted values are calculated.