A paired samples t-test in SPSS is used when you want to compare two related scores from the same participants. A common example is comparing pre-test and post-test scores to see whether a program, treatment, or intervention made a difference. In this guide, you will learn exactly how to run a paired samples t-test in SPSS, how to organize your data correctly, and how to interpret the output step by step.
If you want more background on what this test means, when to use it, and the assumptions to check, read our detailed guide on the paired samples t-test. However, if you already have results and need help writing them up, see our guide on how to report paired samples t-test results in APA style.
Before You Run the Test in SPSS
Before running a paired samples t-test in SPSS, make sure your data is arranged in the right format. This test compares two related measurements from the same participants. That means each participant should have two scores, and both scores should appear on the same row in your dataset.
For example, if you are studying whether a training program improved student performance, you might have one variable for scores before the training and another variable for scores after the training. In SPSS, these could be named Pre_Test and Post_Test. Each row would represent one student, and the two columns would hold the two related scores for that same student.
Both variables should be numeric and measured at the scale level in SPSS. If your data is not structured this way, the test may not reflect the question you actually want to answer.
Example Dataset
To make this guide easy to follow, we will use a simple example dataset throughout all the steps. This helps you see exactly how the paired samples t-test works in practice.
In this example, a researcher wants to examine whether a training program improves students’ performance. The same group of students takes a test before the training and then takes the same test after the training.
The dataset contains two variables:
- Pre_Test: scores before the training program
- Post_Test: scores after the training program
Each row represents one student, with both scores recorded side by side. This structure ensures that the data is paired.
| Student | Pre_Test | Post_Test |
|---|---|---|
| 1 | 55 | 60 |
| 2 | 62 | 65 |
| 3 | 48 | 54 |
| 4 | 70 | 72 |
| 5 | 66 | 70 |
| 6 | 58 | 63 |
| 7 | 61 | 67 |
| 8 | 53 | 59 |
| 9 | 47 | 52 |
| 10 | 64 | 68 |
We will use this example to show how to run the paired samples t-test in SPSS and how to interpret the resulting output.
How to Run a Paired Samples t-Test in SPSS: Step-by-Step
Running a paired sample t-test in SPSS is straightforward once your data is entered correctly. In this example, you already have two related variables in the Data View: Pre_Test and Post_Test. The goal is to test whether the mean score after the training program differs significantly from the mean score before the training program.
Follow these steps to run the test.
Step 1: Enter Your Data in SPSS
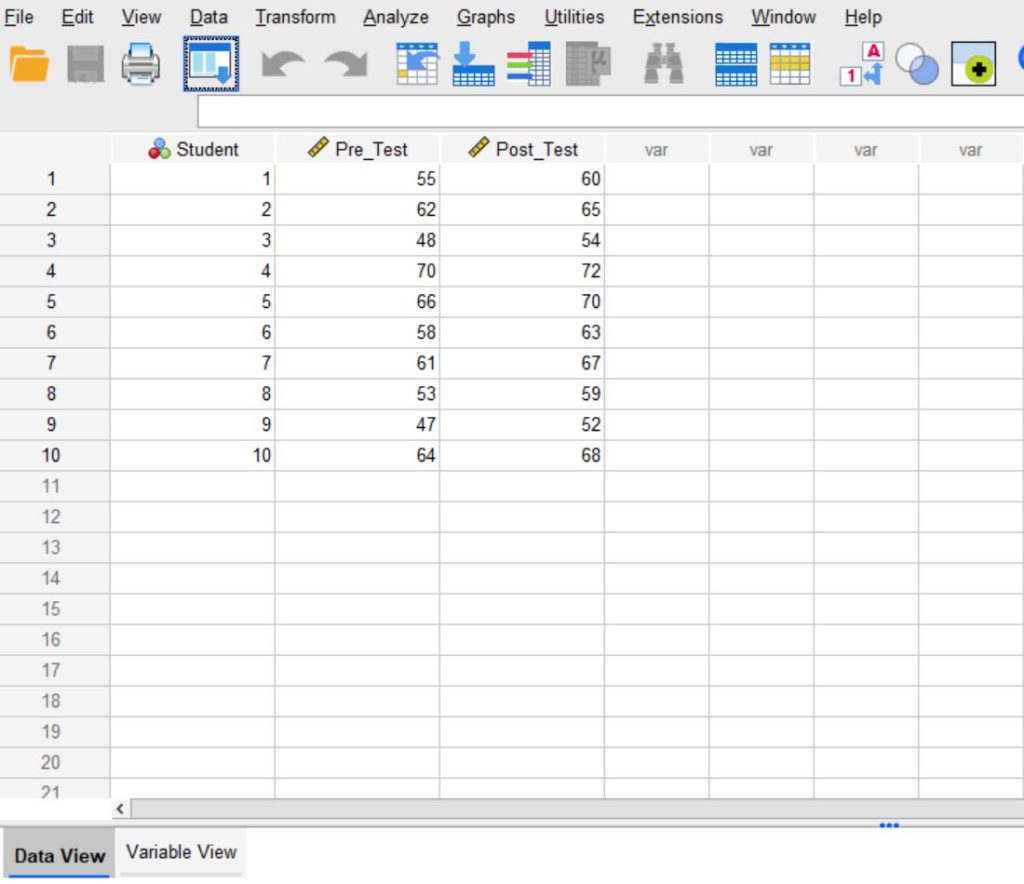
Start by opening SPSS and entering your data in Data View. You need two separate columns for the two related measurements. In this example, one column will contain the pre-test scores and the other will contain the post-test scores.
Make sure each row represents one participant. This part is important. Student 1’s pre-test and post-test scores must be on the same row. Student 2’s two scores must also be on the same row, and so on. If the matching is off, the test will not compare the right pairs.
You should also go to Variable View and confirm that both variables are set as numeric and measured at the Scale level. If you use clear variable names from the start, the SPSS dialog box will be easier to understand later.
Therefore, if you set up the dataset correctly, it should appear as shown below.
Step 2: Open the Paired-Samples T Test Menu
Once your data is ready, go to the top menu in SPSS and click:
Analyze → Compare Means → Paired-Samples T Test
This will open the dialog box used to define and run the paired samples t-test. SPSS uses this window to let you select the two related variables you want to compare.
Make sure you choose Paired-Samples T Test and not another t-test option. SPSS also provides options for a one-sample t-test and an independent samples t-test, but those tests answer different research questions.
If you follow the steps, then you should see the following dialog box.
Step 3: Define the Pair of Variables
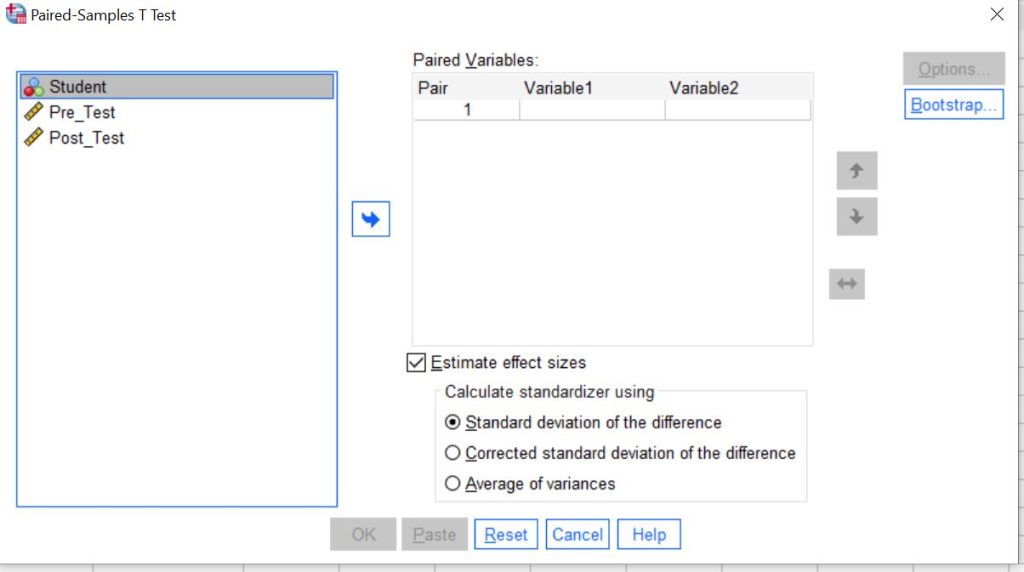
After the dialog box opens, you will see a list of variables on the left side and a box labeled for paired variables on the right side. Now you need to tell SPSS which two variables form the pair.
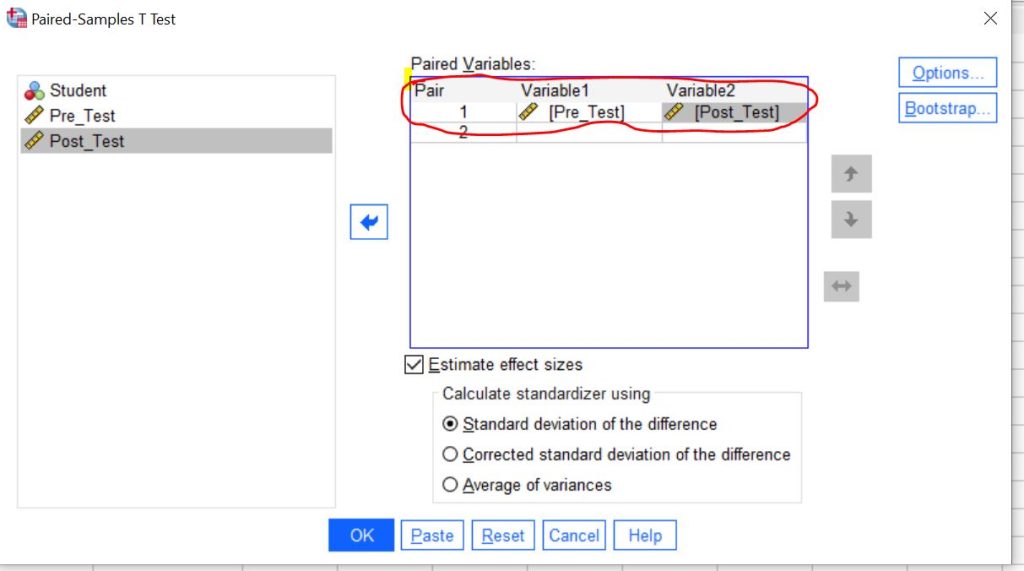
Select Pre_Test and Post_Test, then move them into the paired variables box. They should appear as one pair, with Pre_Test listed first and Post_Test listed second.
Note. The order matters for interpretation. SPSS calculates the mean difference based on the order in which you enter the variables. If you enter Pre_Test first and Post_Test second, the mean difference will reflect Pre_Test minus Post_Test. This affects whether the mean difference appears as positive or negative in the output.
If your aim is to show improvement after training, keep the variable order in mind when interpreting the results.
If you followed the procedure, you should see the following dialog box.
Step 4: Run the Test
After defining the pair, click OK to run the analysis.
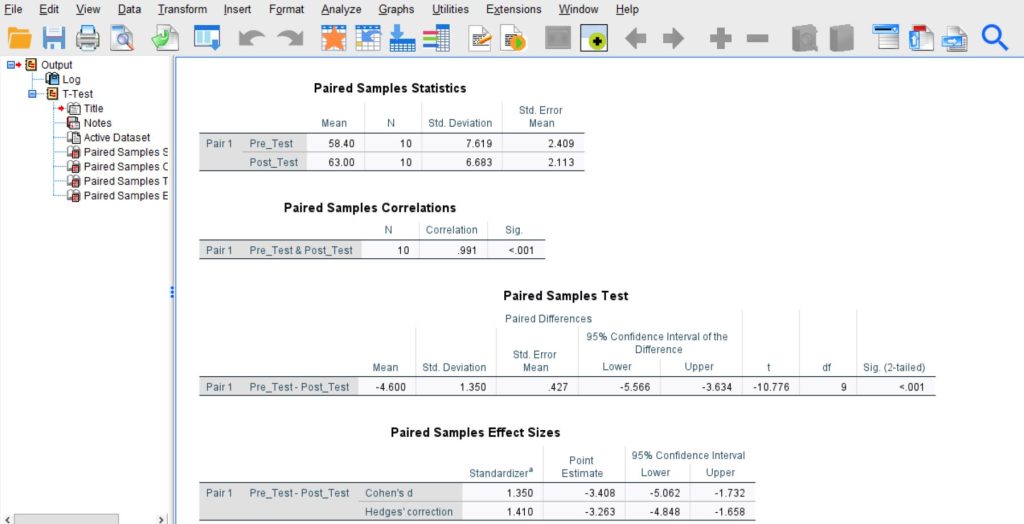
SPSS will generate the paired samples t-test results in the Output Viewer. The output usually includes three main tables:
- Paired Samples Statistics
- Paired Samples Correlations
- Paired Samples Test
These tables provide the descriptive statistics, the correlation between the paired variables, and the actual t-test results. The most important table for interpretation is the Paired Samples Test table because it contains the mean difference, t-value, degrees of freedom, and p-value.
On clicking Ok, SPSS will generate the following Outputs.
Quick Recap of the Steps
If you want the process in a very simple form, here is the full path again:
- Enter the two related variables in two separate columns
- Click Analyze → Compare Means → Paired-Samples T Test
- Move the two variables into the paired variables box
- Click OK
- Review the SPSS output tables
That is all it takes to run the test. The next part is where most users need more support: interpreting the output correctly.
Paired T-Test SPSS Output Tables Explained
After running the paired samples t-test, SPSS produces several output tables. Each table provides important information about your data and results. Below is a clear explanation of what each table shows and how to read it.
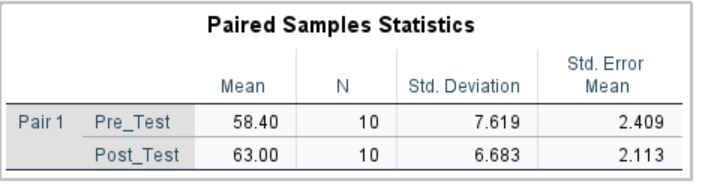
Paired Samples Statistics Table
This table provides descriptive statistics for each variable in the pair. It helps you understand the average scores before and after the intervention.
- Mean shows the average score for each condition (e.g., Pre_Test and Post_Test).
You can compare these means to see whether scores increased or decreased after the training. - N indicates the number of paired observations (i.e., number of participants).
This should match the number of rows in your dataset. - Standard Deviation (SD) shows how much the scores vary around the mean.
A larger standard deviation indicates more variability in the data.
👉 This table gives you a general overview, but it does not tell you whether the difference is statistically significant.
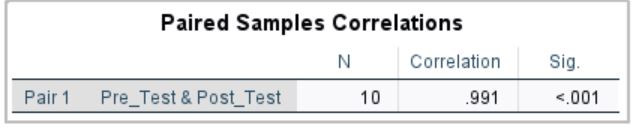
Paired Samples Correlations Table
This table shows the correlation between the two paired variables (e.g., Pre_Test and Post_Test).
- Correlation (r)
Indicates the strength and direction of the relationship between the two sets of scores.
Values range from -1 to +1:- Positive values mean both scores tend to increase together
- Negative values mean one increases while the other decreases
- Significance (p-value)
Tests whether the correlation is statistically significant.
In the context of a paired samples t-test, this table is not used to determine the significance of the mean difference. It simply shows how strongly the two measurements are related.
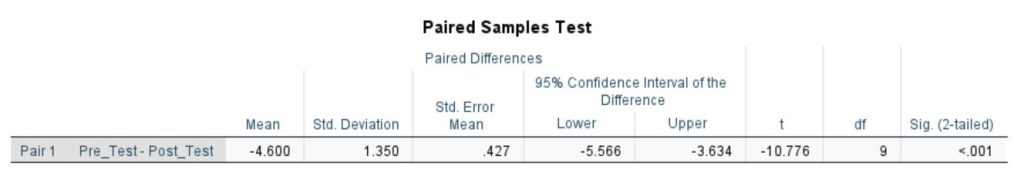
Paired Samples Test Table (Most Important)
This is the key table for interpreting your results. It tells you whether the difference between the two means is statistically significant.
- Mean Difference shows the average difference between the two variables.
This value depends on the order of the variables (e.g., Pre_Test − Post_Test). - t-value (t). This is the test statistic used to determine whether the difference is significant.
A larger absolute t-value generally indicates a bigger difference. - Degrees of Freedom (df). Represents the number of observations used in the analysis, typically calculated as: df = n− 1
- Significance (p-value). This is the most important value for decision-making.
- If p < 0.05, the difference is statistically significant
- If p ≥ 0.05, the difference is not statistically significant
👉 This table answers the main research question: whether the change between the two conditions is significant.
How to Interpret a Paired Samples T-Test in SPSS
Once you understand the tables, interpretation becomes much simpler. A good interpretation usually follows a clear order. Start with significance, then compare the means, then explain the direction of the change in plain language.
Step 1: Check the p-value
Begin with the Sig. (2-tailed) value in the Paired Samples Test table. This tells you whether the mean difference is statistically significant.
Suppose SPSS gives you:
p = .000
In academic reporting, you should not write this as p = .000. Instead, it should be written as:
p < .001
Because this value is less than .05, you would conclude that there is a statistically significant difference between the pre-test and post-test scores.
This is the first decision you should make. Before worrying about direction, always ask: Is the difference significant?
Step 2: Compare the Means
Next, go back to the Paired Samples Statistics table and compare the mean for each condition.
Suppose your output shows:
- Pre-test mean = 58.40
- Post-test mean = 63.00
The post-test mean is higher than the pre-test mean. That means performance improved after the training program.
This is important because statistical significance alone does not tell you the direction of the change. You need the means to see whether scores went up or down.
Step 3: Check the Sign of the Mean Difference
Now look again at the mean difference in the Paired Samples Test table.
Suppose SPSS shows:
Mean difference = -4.600
At first glance, some users think a negative value means the result is bad or that scores have decreased. That is not always true. In this case, the negative sign only reflects the order of the variables. Because SPSS calculated:
Pre_Test – Post_Test
A negative difference means the second score was higher than the first. In other words, students improved.
This is why you should never interpret the sign of the mean difference without first checking the variable order and the actual means.
Step 4: Report the Test Statistic
The next values to include in your interpretation are the t-value and degrees of freedom.
Suppose the output shows:
t(9) = -10.776, p < .001
This means the test found a statistically significant difference between the two related means, with 9 degrees of freedom. The large absolute t-value also suggests a big difference between conditions.
Step 5: Write the Conclusion in Plain Language
The final step is to explain the result in a way that answers the actual research question. For our example, a plain-language interpretation would be:
There was a statistically significant increase in students’ test scores after the training program. Students performed better on the post-test than on the pre-test.
This kind of statement is much more useful than repeating output values without explanation. Academic readers want to know what the numbers mean in context.
Full Example Interpretation
Here is a clean interpretation based on the example output:
A paired samples t-test showed that post-test scores were significantly higher than pre-test scores, t(9) = -10.78, p < .001. The mean score increased from 58.40 before the training to 63.00 after the training. This indicates that the training program was associated with a statistically significant improvement in student performance.
That is the kind of interpretation most instructors and supervisors expect. It gives the key numbers, explains the direction of change, and ends with a clear conclusion.
How to Know Whether the Change Was an Increase or a Decrease
One of the most common sources of confusion in SPSS is the sign of the mean difference. Many students assume that a negative mean difference means the scores went down. In a paired samples t-test, that is not always true.
The sign depends entirely on the order of the variables:
- If SPSS calculates Pre_Test – Post_Test, a negative difference means the second score was higher
- If SPSS calculates Post_Test – Pre_Test, a positive difference means the second score was higher
So the safest way to determine direction is this:
- Compare the means in the statistics table
- Confirm the order of the variables in the SPSS dialog box
- Use the sign of the mean difference only after doing those two checks
This simple habit can prevent major interpretation errors.
Common Mistakes to Avoid
Even though the paired samples t-test is one of the easier tests to run in SPSS, there are still several mistakes that can lead to confusion or weak reporting. Avoiding these errors will make your interpretation much more accurate.
- Treating Independent Groups as Paired Data. A paired samples t-test should only be used when the two measurements are related. If you are comparing two different groups of people, such as male and female students, then the data is not paired, and this is not the correct test. In that case, you would usually need an independent samples t-test instead.
- Entering Data in the Wrong Structure. Each row in the dataset should represent one participant, and the two related measurements should appear in separate columns. If the data is split incorrectly or the pairing is lost, SPSS will still run something, but the result will not answer your intended question.
- Misreading the Mean Difference. Students often see a negative mean difference and assume the second score is lower. That can be wrong. The sign depends on the order of the variables entered into SPSS. Always check the means and confirm the variable order before interpreting direction.
- Focusing on the Correlation Table Instead of the Test Table. The paired samples correlation table can be useful for descriptive context, but it does not tell you whether the mean difference is statistically significant. Your main decision should come from the Paired Samples Test table.
- Writing p = .000. SPSS sometimes displays the p-value as .000, but this should never be written that way in academic work. The correct format is: p < .001. This is a small detail, but it matters in formal reporting.
- Ignoring the Means. Even if the p-value tells you the difference is significant, you still need to compare the means to know what happened. Statistical significance tells you that a difference exists. On the other hand, the means help tell you what kind of difference it was.
Practical Tips for Better Interpretation
A good interpretation is not just about copying numbers from SPSS. It is about understanding which values matter and how they connect to your research question. Here are a few practical tips that make the process easier.
- Always start with the research question in mind. Ask yourself what the two variables represent and what kind of change you are expecting. This keeps the interpretation grounded.
- Keep your variable names clear in SPSS. Names like Pre_Test and Post_Test make the output easier to read than vague labels.
- Read the tables in a logical order. Look at the statistics table for the means, then the test table for significance, and then combine both pieces of information into one clear conclusion.
- Do not treat SPSS output as a final explanation. The output gives you the numbers, but you still need to translate those numbers into meaningful language for your assignment, dissertation, or report.
When to Seek Help with SPSS Data Analysis
Paired samples t-tests are easy to run in SPSS, but interpreting the results and reporting them correctly can be challenging. Many students struggle with understanding output tables, checking assumptions, and writing results in proper APA format. Small mistakes in interpretation or reporting can affect the quality of your research.
If you’re unsure whether your paired samples t-test results are correct, professional SPSS data analysis help can ensure accurate results and proper reporting.
Key Takeaways
A paired samples t-test in SPSS is used to compare two related scores from the same participants. The procedure itself is simple once the data is arranged correctly. You enter the two related variables in separate columns, open the paired-samples t-test option in SPSS, define the pair, and run the analysis.
The most important part of the output is the Paired Samples Test table, because this is where you find the p-value, mean difference, t-value, and degrees of freedom. To interpret the result correctly, first check whether the p-value is below .05, then compare the means, and finally explain the direction of the change in plain language.
If you need help writing the result formally, read our guide on how to report paired samples t-test results in APA style. If you want more background on the test, including assumptions and when to use it, visit our complete paired samples t-test guide. Together, those pages will give readers a full path from understanding the test to running it in SPSS and reporting it correctly.