An independent samples t-test compares the means of two separate groups to determine whether the difference between them is statistically significant. It is commonly used when you want to compare outcomes between two independent groups, such as males vs females or treatment vs control. However, many users struggle when running this test in SPSS. Common challenges include selecting the correct variables, defining groups properly, and interpreting the output tables. This guide focuses on practical execution to help you avoid these issues. Specifically, you’ll learn how to perform an independent samples T-Test in SPSS and how to interpret the outputs.
If you are new to the concept and want to learn what an independent t-test is, when to use it, and its assumptions, see our comprehensive independent Samples t-test guide. Already knows how to run the test in SPSS and needs a guide on how to present the results in APA? Check out our detailed step-by-step guide on reporting independent samples t-test results in APA.
What You Need Before Running the Test
Before you run an independent samples t-test in SPSS, make sure you have a few key things ready. This will save you time and help you avoid errors during the process.
You need:
- Two independent groups (e.g., Group 1 and Group 2)
- One continuous dependent variable (e.g., scores, income, ratings)
- Data already entered in SPSS in the correct format
If these three conditions are met, you are ready to proceed with running the test.
How to Prepare Your Data in SPSS
Before you run an independent samples t-test in SPSS, you need to organize your data correctly. You should have one column for the grouping variable and one column for the test variable. Each row should represent one participant.
Example
A researcher wants to examine whether a new teaching method improves student performance. The researcher selects a group of students and randomly assigns them to two groups.
- Group 1 uses the traditional teaching method
- Group 2 uses the new teaching method
At the end of the term, all students take the same exam. The researcher records their scores and wants to compare the mean scores between the two groups. The goal is to determine whether the new teaching method leads to significantly higher scores.
Variable Setup in SPSS
To analyze this data in SPSS, you need to define two variables:
- Grouping variable (Teaching Method)
- 1 = Traditional method
- 2 = New method
- Test variable (Exam Score)
- Continuous values (e.g., 65, 78, 82)
In Variable View:
- Set Teaching Method as Numeric and define value labels (1 = Traditional, 2 = New)
- Set Exam Score as Scale.
If you want to follow along with this guide, you can download the dataset used in this example.
How to Run an Independent Samples T-Test in SPSS (Step-by-Step)
Follow the steps below to run an independent samples t-test in SPSS. This guide starts with importing the Excel dataset so that beginners can follow the full process from start to finish.
Step 1: Open SPSS and Import Your Excel Dataset
First, open SPSS on your computer. If your data is saved in Excel, you need to import it before you run the test.
To import the file:
- Click File
- Click Import Data
- Select Excel
A file browser window will open. Find the Excel file you want to use, select it, and click Open.
SPSS will then show an import dialog box. In this window:
- Choose the correct worksheet if your Excel file has more than one sheet
- Tick the option Read variable names from the first row of data if your first row contains column names such as Method and Score
- Check that the preview looks correct
Then click OK to import the data.
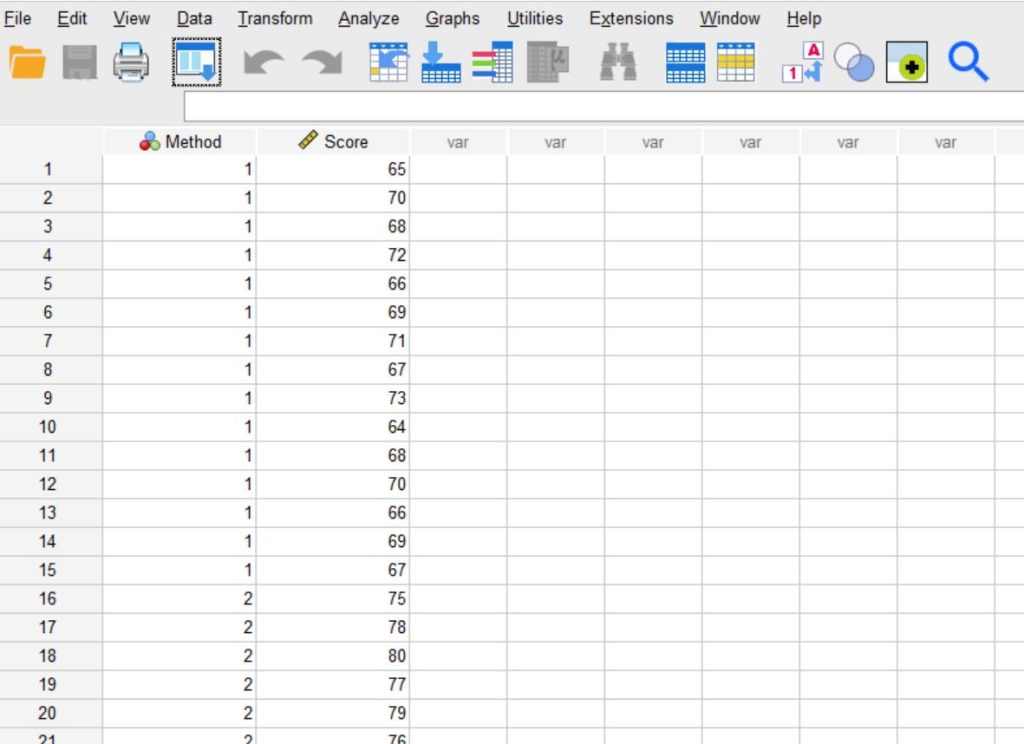
After the file opens, SPSS will display your dataset in Data View. Each row should represent one participant, and each column should represent one variable.
For our example, your dataset should include:
- Method as the grouping variable
- Score as the test variable
Step 2: Check That the Variables Imported Correctly
Before you run the test, make sure SPSS imported the variables correctly. This step is important because the test may not run properly if the variables have the wrong type or measurement level.
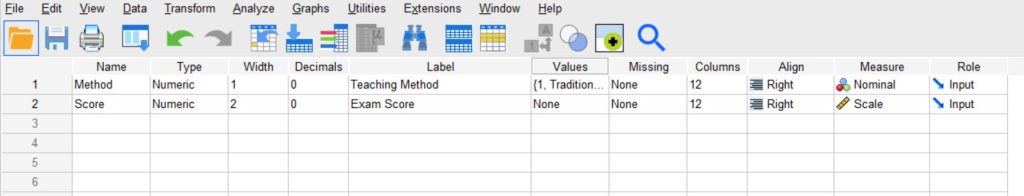
Click Variable View at the bottom of the SPSS window and review the variables.
For this example:
Method
This is your grouping variable. It shows which student belongs to which teaching method group.
Set it up as follows:
- Name: Method
- Type: Numeric
- Label: Teaching Method
- Values:
- 1 = Traditional method
- 2 = New method
- Measure: Nominal
Score
This is your dependent variable. It contains the exam scores.
Set it up as follows:
- Name: Score
- Type: Numeric
- Label: Exam Score
- Decimals: You can use 0 if scores are whole numbers
- Measure: Scale
If SPSS imported the variables correctly, you can move to the next step. If not, correct them here before continuing.
Step 3: Open the Independent Samples T-Test Window
Now go to the menu at the top of SPSS:
- Click Analyze → Compare Means → Independent-Samples T Test
This will open the main dialog box where you assign the variables for the test.
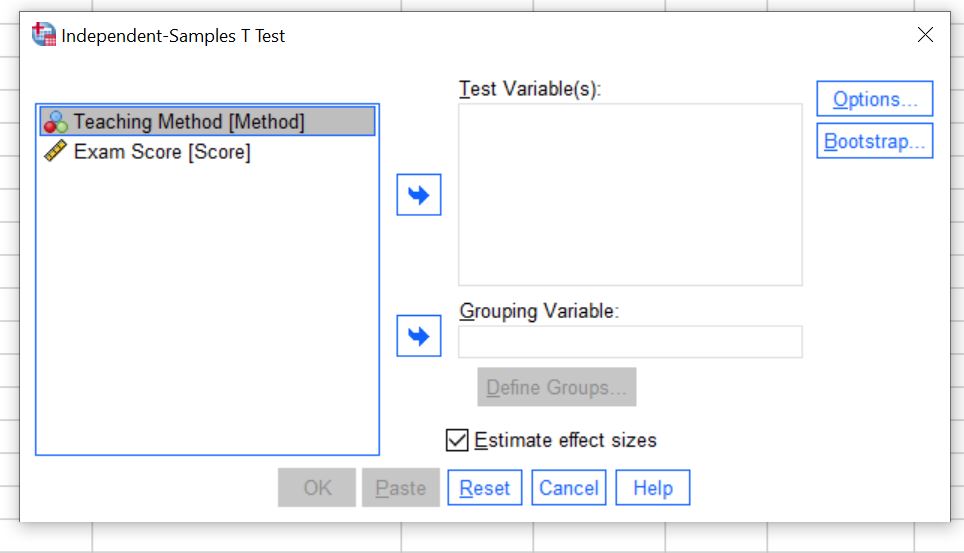
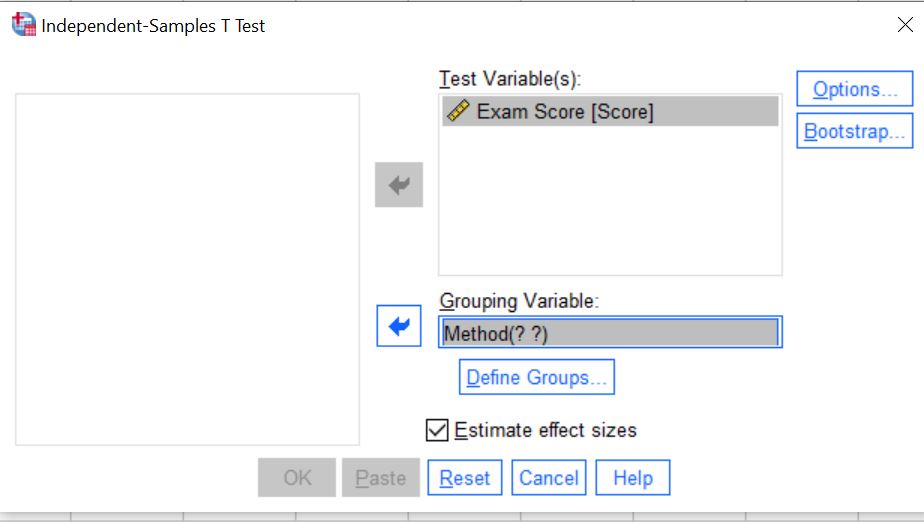
Step 4: Move the Variables to the Correct Boxes
In the Independent-Samples T Test dialog box, you will see several empty fields.
Now assign the variables:
- Move Score to the Test Variable(s) box
- Move Method to the Grouping Variable box
To do this:
- Click the variable name on the left
- Click the arrow button to move it to the correct box
At this stage, SPSS knows:
- Score is the variable whose means you want to compare
- The method is the variable that divides the data into two groups
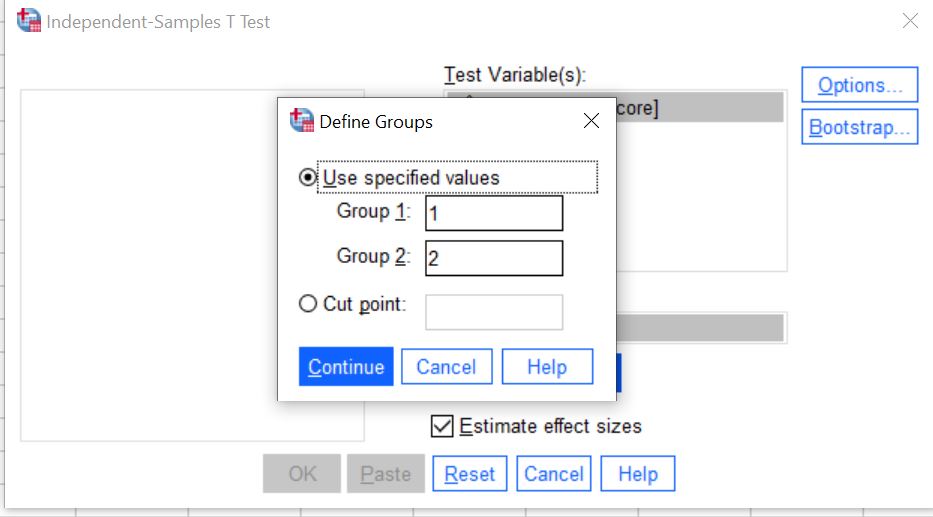
Step 5: Define the Two Groups
After moving the grouping variable, you need to tell SPSS which codes represent the two groups.
- Click Define Groups
A small dialog box will appear. Enter the group values:
- Group 1:
1 - Group 2:
2
These values come from the way you coded the grouping variable:
- 1 = Traditional method
- 2 = New method
Then click Continue.
This step is necessary because SPSS needs to know exactly which two groups to compare.
Step 6: Click OK to Run the Test
Once you define the groups:
- Click OK
SPSS will process the data and open a new Output Viewer window. This window will contain the results of the independent samples t-test.
You will usually see two main tables:
- Group Statistics
- Independent Samples Test
These tables contain the information you need to interpret the results and write them up in APA style.
Want to learn how to report the results in APA style? Visit our detailed guide on how to report independent samples t-test results in APA style.
SPSS Output Tables Explained
After running the independent samples t-test in SPSS, you will see three main tables in the output:
- Group Statistics
- Independent Samples T Test
- Independent Samples Effect Sizes
Each table provides different information. Together, they help you understand, interpret, and report your results.
Group Statistics Table
This table provides a summary of each group. It gives you a quick overview of the data before you check statistical significance.
What You Should Look For
- Mean. The average score for each group. This helps you see which group has higher or lower values.
- Standard Deviation (SD). Shows how spread out the scores are within each group.
- Sample Size (N). The number of participants in each group.
This table helps you understand the basic differences between groups before running the actual significance test.
Independent Samples T-Test Table
This is the most important table. It tells you whether the difference between the two groups is statistically significant.
What You Should Look For
- Levene’s Test for Equality of Variances helps you decide which row of results to use (equal variances assumed or not assumed).
- t-value shows the size and direction of the difference between the group means.
- Degrees of Freedom (df). Used along with the t-value to determine significance.
- Significance (p-value). This is the key result. It tells you whether the difference between groups is statistically significant.
This table answers the main question: Is there a significant difference between the two groups?
Independent Samples Effect Sizes Table
This table shows the magnitude of the difference between the groups. It helps you understand how large or meaningful the difference is.
What You Should Look For
- Cohen’s d. The most commonly used effect size. It shows how large the difference is in standard deviation units.
- Hedges’ correction is a slightly adjusted version of Cohen’s d, often used for smaller samples.
- Glass’s delta is another measure of effect size based on one group’s variability.
This table helps you answer: How large is the difference between the groups?
How to Interpret Independent Samples T-Test SPSS Outputs
Once SPSS produces the output, you need to interpret the results in the correct order. This helps you avoid using the wrong row or drawing the wrong conclusion. For an independent samples t-test, start with Levene’s test, then move to the t-test results, and finally compare the group means.
Step 1: Check Levene’s Test
First, look at Levene’s Test for Equality of Variances in the Independent Samples Test table. This test shows whether the variances of the two groups are equal.
- If the significance value for Levene’s test is greater than .05, you can assume equal variances
- If the significance value is less than .05, you should not assume equal variances
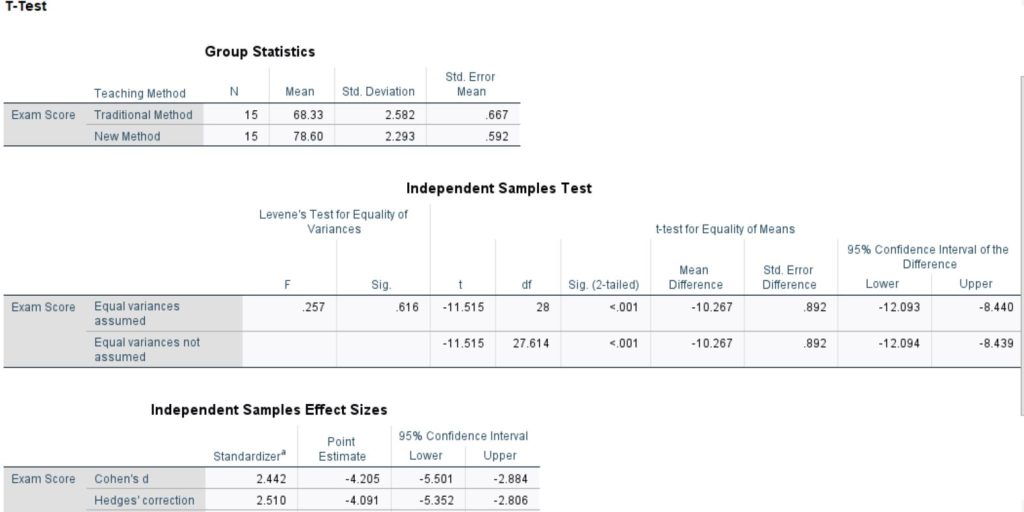
In our example, the significance value for Levene’s test is .616. Since .616 is greater than .05, the assumption of equal variances is met.
Step 2: Choose the Correct Row
After checking Levene’s test, choose the correct row from the Independent Samples T Test table.
- Use Equal variances assumed when Levene’s test is not significant
- Use Equal variances, not assumed when Levene’s test is significant
Since Levene’s test in our example is not significant (p = .616), we use the first row, which assumes equal variances.
Step 3: Interpret the p-value
Next, look at the Sig. (2-tailed) value in the correct row. This is the p-value for the independent samples t-test. It tells you whether the difference between the two group means is statistically significant.
- If p < .05, the difference is statistically significant
- If p > .05, the difference is not statistically significant
In our example, the p-value is .000. In SPSS, this does not mean the value is exactly zero. It means p < .001. Since this value is less than .05, there is a statistically significant difference between the two teaching methods.
Step 4: Compare the Group Means
After confirming that the result is significant, compare the means in the Group Statistics table to see which group scored higher.
In our example:
- The Traditional Method group has a mean score of 68.33
- The New Method group has a mean score of 78.60
This shows that students in the New Method group scored higher on average than students in the Traditional Method group.
Example Interpretation
The results of the independent samples t-test showed that the two groups had significantly different mean exam scores. Levene’s test for equality of variances was not significant (p = .616), so the equal variances assumption was met. The independent samples t-test showed a statistically significant difference in exam scores between students taught using the traditional method and those taught using the new method, t(28) = -11.515, p < .001. The mean score for the traditional method group (M = 68.33) was lower than the mean score for the new method group (M = 78.60). This result suggests that the new teaching method produced better exam performance.
Common Mistakes to Avoid
Even though it is easy to run the independent samples t-test in SPSS, small mistakes can affect your results and interpretation. Here are some common issues to watch out for:
- Not defining groups correctly. Entering the wrong group codes will lead to incorrect comparisons or errors in SPSS.
- Using the wrong variable types. The dependent variable must be continuous, and the grouping variable must be categorical with two groups.
- Ignoring Levene’s test. You must check Levene’s test before choosing which row of results to interpret.
- Misinterpreting p-values. Always compare the p-value to your significance level (usually .05) to decide whether the difference is statistically significant.
Avoiding these mistakes will help you get accurate results and make correct conclusions.
Conclusion
An independent samples t-test helps you determine whether there is a significant difference between the means of two independent groups. It is one of the most commonly used statistical tests in research, and SPSS makes it easy to run once your data is properly prepared.
To run an independent samples t-test in SPSS, you can follow these simple steps:
- Import your dataset into SPSS
- Check and define your variables in Variable View
- Go to Analyze → Compare Means → Independent-Samples T Test
- Move the dependent variable to Test Variable(s)
- Move the grouping variable to Grouping Variable
- Define the group codes (e.g., 1 and 2)
- Click OK to run the test
Once you run the test, focus on interpreting the output correctly.
When to Seek Help with SPSS Analysis
Running an independent samples t-test in SPSS is straightforward, but interpretation can sometimes be challenging. Many users struggle to choose the correct row after Levene’s test or to explain the results clearly. Small mistakes in interpretation can lead to incorrect conclusions.
Reporting is also important. You need to present your results accurately, especially when using APA style. This includes the correct t-value, degrees of freedom, p-value, and group statistics.
If you’re unsure whether your results are correct, professional SPSS data analysis help can ensure accurate results and proper reporting.