If you have already run your analysis in SPSS, the next step is to report your independent samples t-test results in APA style. This step matters more than most students think. You can run the correct test and still lose marks if your reporting is unclear or incomplete. In this guide, you will learn how to read SPSS output correctly, extract the right values, write a complete APA-style report, and avoid common mistakes. If you have not run the test yet, read our guide on how to run an independent samples t-test in SPSS first, then come back here to write your results.
What is APA Reporting for an Independent Samples T-Test?
APA reporting is a standardized way of presenting statistical results in research papers, assignments, and dissertations. It ensures that your findings are clear, consistent, and easy for readers to understand. Instead of overwhelming your audience with raw SPSS output, APA style helps you communicate the most important results in a structured and professional way.
Rather than copying tables directly from SPSS, you are expected to summarize the results in a clear narrative. This means you should:
- Write results in sentence form
- Focus only on key statistics (e.g., means, t-value, p-value)
- Explain what the results mean in context
Tip. The main aim of reporting independent t-test results in APA is to make your results easy to understand, even for someone who has not seen your SPSS output.
What to Include in an APA Report
Many students ask, “What exactly do I need to include when reporting an independent samples t-test?” The good news is that APA reporting follows a clear and predictable structure. Once you understand the key components, you can apply the same format to any dataset or assignment. This makes your work not only easier but also more consistent and professional.
If you’re looking for a quick answer, here is what you must include in your APA report:
- The test name (independent samples t-test)
- The groups being compared
- Means (M) and standard deviations (SD) for each group
- Levene’s test result (to justify the variance assumption)
- t-value, degrees of freedom (df), and p-value
- A clear interpretation of the findings
In simple terms, your report should tell the reader what you tested, what you found, and what it means.
Understanding Your SPSS Output
Before you start writing your APA report, you first need to understand what each table in the SPSS output means. Many students make mistakes at this stage because they try to write results without fully understanding where the numbers come from. If you follow the how to run an independent samples t-test in SPSS guide, you will already have the output ready. The next step is to extract the correct values and use them properly in your write-up.
From that example, SPSS produces several tables, but for APA reporting, you will mainly focus on three: Group Statistics, Independent Samples Test, and sometimes Effect Sizes. We will use the same example outputs throughout this guide so you can clearly see how to move from SPSS output to a complete APA report.
1. Group Statistics Table
The Group Statistics table gives you a summary of each group before you check statistical significance. This is where you extract the descriptive statistics that you must report in APA style.
This table shows:
- Mean (M)
- Standard deviation (SD)
- Sample size (N)
- Standard error of the mean (SE)
However, when reporting in APA style, you will mainly use:
- Mean (M)
- Standard deviation (SD)
- Sample size (N)
The standard error (SE) is useful for understanding sampling variability, but it is not typically required in APA reporting for an independent samples t-test.
Example from your output:
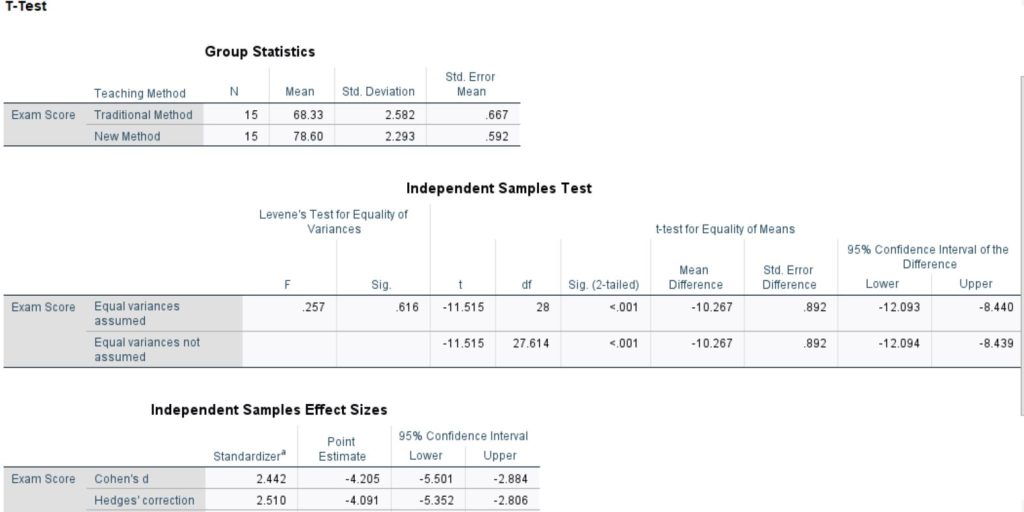
- Traditional method: M = 68.33, SD = 2.58, N = 15
- New method: M = 78.60, SD = 2.29, N = 15
This immediately tells you that the new teaching method group performed better because it had a higher mean score.
These values will later appear in your APA report when you describe each group. Always start with this table because it helps you understand the direction of the results before you look at statistical significance.
Why This Table Matters
The Group Statistics table is not just for description—it helps you:
- Identify which group has higher or lower scores
- Understand the spread of the data using SD
- Confirm the sample size (N) for each group
- Provide context before reporting the t-test results
Think of it this way: before you say whether the difference is significant, you must first show what the difference actually looks like.
2. Independent Samples Test Table
The Independent Samples Test table is the most important table in your SPSS output. This is where you determine whether the difference between the two groups is statistically significant. It also provides the key values you need for APA reporting.
This table includes:
- Levene’s test for equality of variances
- t-value
- Degrees of freedom (df)
- p-value (Sig. 2-tailed)
- Mean difference
- Standard error of the difference
- Confidence interval (CI) of the difference
However, for APA reporting, you will mainly focus on:
- Levene’s test
- t-value
- Degrees of freedom (df)
- p-value
The mean difference, standard error difference, and confidence interval are useful for deeper interpretation, but they are optional in basic APA reporting unless specifically required.
Example from your output:
- Levene’s test: p = .616
- t(28) = -11.52
- p < .001
Since Levene’s test is not significant (p > .05), you use the “equal variances assumed” row.
How to Read This Table Correctly
You should always follow this order:
- Check Levene’s test
- If p > .05 → use equal variances assumed
- If p < .05 → use equal variances not assumed
- Select the correct row
- This ensures you report the correct t and df
- Look at the p-value
- If p < .05 → significant difference
- If p > .05 → not significant
In this example, p < .001, which means the difference between the two groups is statistically significant.
Why This Table Matters
The Independent Samples Test table helps you:
- Determine whether the difference between groups is statistically significant
- Identify the correct statistical values to report (t, df, p)
- Understand the magnitude and direction of the difference (via mean difference)
- Assess the precision of the estimate using the confidence interval
In simple terms, this table answers the main research question: Is the difference between the two groups real or due to chance?
3. Effect Size Table (Optional but Recommended)
The Effect Size table provides additional information about the magnitude of the difference between the two groups. While the t-test tells you whether the difference is statistically significant, the effect size tells you how large or meaningful that difference is in practice.
This table shows:
- Cohen’s d
- Hedges’ g
- Glass’s delta
These measures express the difference between groups in standardized units, making it easier to understand the practical importance of your results.
How to Interpret Effect Size
Among these measures, Cohen’s d is the most commonly reported in APA style. It follows general guidelines:
- 0.2 → Small effect
- 0.5 → Medium effect
- 0.8 or higher → Large effect
For example, a large effect size means the difference between groups is not only statistically significant but also practically important.
Why This Table Matters
The Effect Size table helps you:
- Understand the practical significance of your results
- Go beyond just “significant vs not significant.”
- Strengthen your analysis, especially in dissertations and research papers
In simple terms, while the p-value tells you if there is a difference, the effect size tells you how big that difference really is.
Step-by-Step: How to Report an Independent T-Test in APA
Now that you understand the SPSS output, the next step is to turn those results into a clear APA-style report. The process is straightforward if you follow a consistent structure. You should always move from describing the test to presenting the results and finally to explaining what those results mean.
Follow this exact structure every time:
Step 1: State the Test and Purpose
Start by clearly stating:
- What test did you use
- What were you comparing
This helps the reader understand the context of your analysis.
Example: An independent samples t-test was conducted to compare exam scores between students taught using a traditional method and those taught using a new teaching method.
Step 2: Report Descriptive Statistics
Next, report the descriptive statistics for both groups. These come from the Group Statistics table.
Include:
- Mean (M)
- Standard deviation (SD)
Example:
Students in the traditional method group scored lower (M = 68.33, SD = 2.58) than students in the new method group (M = 78.60, SD = 2.29).
Always report both groups so the reader can see the direction of the difference.
Step 3: Report Levene’s Test
Before reporting the t-test results, you need to justify which row of the SPSS output you used. This is done using Levene’s test for equality of variances.
Rules:
- p > .05 → equal variances assumed
- p < .05 → equal variances not assumed
Example: Levene’s test for equality of variances was not significant (p = .616), indicating that equal variances were assumed.
Step 4: Report the t-Test Results
Now report the main results from the Independent Samples Test table.
Include:
- t-value
- Degrees of freedom (df)
- p-value
Example: The independent samples t-test showed a statistically significant difference between the groups, t(28) = -11.52, p < .001.
This tells the reader whether the difference between groups is statistically significant.
Step 5: Provide Interpretation
Finally, explain what the results mean in simple terms. This is where you connect the statistics to your research question.
Example: This result suggests that the new teaching method significantly improves student performance.
This step-by-step approach ensures that your report is:
- Clear and easy to follow
- Aligned with APA guidelines
- Complete and professional
Full Independent Samples T-Tes Results APA Example (From Your SPSS Output)
Now that you understand each step, let’s bring everything together into one complete APA-style paragraph. This is the exact format examiners expect, and you can use it as a model for your own assignments.
Here is the full paragraph:
An independent samples t-test was conducted to compare exam scores between students taught using the traditional method and those taught using a new teaching method. Levene’s test for equality of variances was not significant (p = .616), indicating that equal variances were assumed. Students in the new method group (M = 78.60, SD = 2.29) scored higher than students in the traditional method group (M = 68.33, SD = 2.58). This difference was statistically significant, t(28) = -11.52, p < .001. These findings suggest that the new teaching method improves student performance.
How to Report Non-Significant Results
Not all results will be statistically significant and that is completely normal. A non-significant result does not mean your analysis is wrong or useless. It simply means that the data did not provide enough evidence to conclude that a real difference exists between the groups.
When reporting non-significant results, you should follow the same structure as before. The only difference is in how you phrase the conclusion. Instead of saying there is a significant difference, you clearly state that no statistically significant difference was found.
Example:
An independent samples t-test was conducted to compare exam scores between male and female students. Levene’s test was not significant (p > .05), indicating that equal variances were assumed. The results showed no statistically significant difference between male students (M = 72.10, SD = 8.45) and female students (M = 74.25, SD = 7.90), t(58) = -1.12, p = .267. This suggests that gender does not significantly affect exam performance.
NOTE. Always report your findings honestly. Even non-significant results are valuable, especially in research and dissertations, because they still answer your research question.
How to Report When Equal Variances Are Not Assumed
In some cases, Levene’s test will be significant. This means the assumption of equal variances has been violated, and you cannot use the first row of the SPSS output. Instead, you must use the “equal variances not assumed” row, which is based on Welch’s t-test.
Key points to remember:
- If Levene’s test is significant (p < .05), use the second row
- The degrees of freedom (df) may appear as a decimal
- You still follow the same APA reporting structure
Example:
Levene’s test was significant (p < .05), indicating that the assumption of equal variances was violated. Therefore, results from the equal variances not assumed row were used. The independent samples t-test showed a statistically significant difference between the groups, t(24.36) = 2.45, p = .021.
The only real difference here is the row you use and the possibility of decimal df. The reporting format remains the same.
How to Report Effect Size (Highly Recommended)
While the p-value tells you whether a difference exists, the effect size tells you how strong or meaningful that difference is. This makes your results more informative, especially in research papers and dissertations.
The most commonly reported effect size for an independent samples t-test is Cohen’s d.
General guidelines for interpreting Cohen’s d:
- 0.2 → Small effect
- 0.5 → Medium effect
- 0.8 or higher → Large effect
Example:
The effect size was large (Cohen’s d = 1.20), indicating a substantial difference between the groups.
Including effect size strengthens your analysis because it shows that your results are not only statistically significant but also practically meaningful.
APA Reporting Template (Copy This)
If you ever feel stuck when writing your results, a simple template can save you time and help you avoid mistakes. Instead of trying to remember every detail, you can follow a clear structure and just fill in your values from SPSS. This ensures your report stays accurate, consistent, and aligned with APA guidelines.
Use the template below whenever you need to report an independent samples t-test:
An independent samples t-test was conducted to compare [dependent variable] between [Group 1] and [Group 2]. Levene’s test was [not significant/significant] (p = ___), indicating that [equal variances were assumed/not assumed]. [Group 1] (M = ___, SD = ___) [scored higher/lower] than [Group 2] (M = ___, SD = ___). This difference was [statistically significant/not significant], t(df) = ___, p = ___. These results suggest that [interpretation].
You can reuse this structure for assignments, reports, and dissertations. Just replace the placeholders with your actual results, and your APA reporting will always be clear and complete.
Common Mistakes to Avoid When Reporting Independent T-Test Results in APA Style
Even when your analysis is correct, small reporting mistakes can cost you marks. Most of these errors are easy to avoid once you know what to look out for. Below are some of the most common mistakes students make when reporting an independent samples t-test in APA style:
- Writing p = 0.000 → ✔ Always report as p < .001
- Copying and pasting SPSS tables instead of writing results in sentences
- Ignoring Levene’s test and not stating which row was used
- Missing interpretation (not explaining what the results mean)
- Not reporting the standard deviation (SD) alongside the mean
Avoiding these simple mistakes will make your report look more professional and aligned with APA standards.
Quick Checklist
Before you submit your assignment or report, take a moment to review your work. This quick checklist will help you confirm that your APA reporting is complete and accurate. Even small omissions can affect your marks, so it’s worth double-checking everything.
Make sure you have included:
- Test clearly stated
- Groups identified
- Means (M) and standard deviations (SD) included
- Levene’s test reported
- t-value, degrees of freedom (df), and p-value included
- Clear interpretation of the results
If all items are checked, your report is well-structured and meets APA reporting standards.
Conclusion
Reporting an independent samples t-test in APA style may seem difficult at first, but it becomes straightforward once you follow a clear structure. The key is to move step by step, from identifying the correct values in SPSS, to presenting them in a clean and organized format, and finally explaining what they mean in context.
By focusing on the essentials, you can produce reports that are both accurate and easy to understand. More importantly, you avoid common mistakes that often cost students marks, such as missing key statistics or copying SPSS output directly.
In simple terms, good APA reporting is about clarity, not complexity. If you consistently apply the approach outlined in this guide, your results will always look professional and meet academic standards.
Need Help With Your SPSS Analysis or APA Reporting?
If you’re still unsure whether your results are correct or you want to make sure your APA reporting is perfect, you don’t have to figure it out alone.
At SPSSAnalysisHelp.com, we help students with:
- SPSS data analysis (t-tests, ANOVA, regression, etc.)
- Clear interpretation of results
- APA-style reporting for assignments and dissertations
- Full results and discussion chapters
Whether you’re stuck on your output or just want a second pair of expert eyes, we’ve got you covered.
Submit your dataset or instructions today and get accurate, well-explained results delivered on time.