A paired sample t-test is used to compare the means of the same group measured at two different times. It is commonly applied in situations like pre-test vs post-test or before-and-after studies to determine whether a meaningful change has occurred. While running the test in SPSS is relatively straightforward, many students struggle with reporting the results correctly in APA style. This guide will walk you through how to report paired samples t-test results in APA style using real examples.
Want to learn how to perform the test in SPSS? Visit our step-by-step tutorial on how to perform a paired t-test in SPSS.
What is a Paired Sample T-Test? (Quick Refresher)
A paired sample t-test (also known as a dependent t-test) is a statistical test used to compare the means of the same group measured at two different time points or under two conditions. It helps determine whether the change observed is statistically significant.
This test is appropriate when the same participants are measured twice, and the outcome variable is continuous, such as scores, weight, or income. Instead of comparing different groups, it focuses on the differences within the same individuals.
Common examples include comparing pre-test and post-test scores, evaluating results before and after an intervention, or measuring performance before and after training.
What You Need to Report Paired Samples T-Test Results in APA Style
When reporting a paired sample t-test in APA style, you need to present your results clearly and consistently. APA focuses on both the statistical values and a concise interpretation of what those values mean in context. The goal is to make your findings easy to understand while maintaining proper academic formatting.
To do this, make sure you include the following key components:
- Test type (paired sample t-test)
- Purpose of the test (what you are comparing)
- Means (M) and standard deviations (SD) for both conditions
- Sample size (N)
- t-value
- Degrees of freedom (df)
- p-value
- Effect size (Cohen’s d) (optional but recommended)
Including all these elements ensures your results are complete, transparent, and aligned with APA guidelines.
Understanding Paired Samples T-Test SPSS Outputs
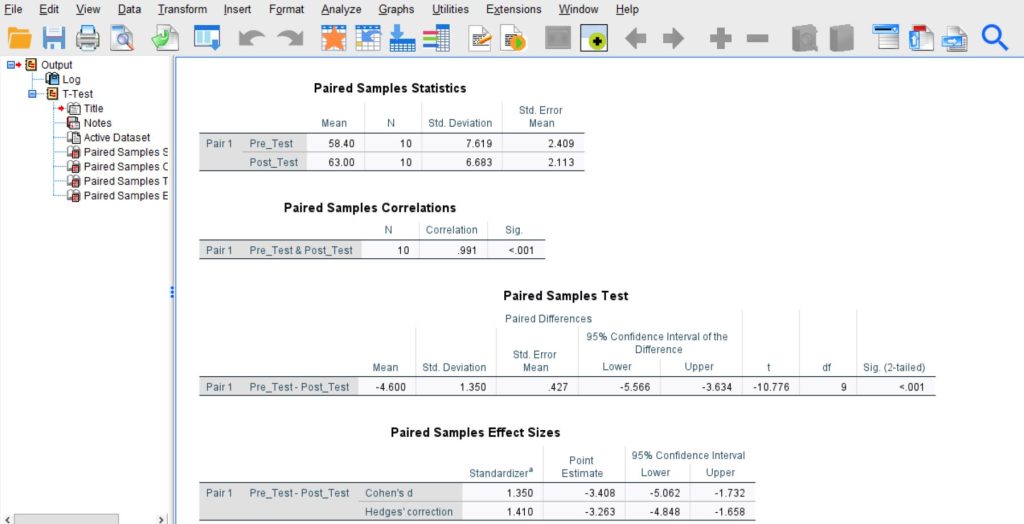
The SPSS output below is based on the same example used in the guide on how to run a paired sample t-test in SPSS. When reporting in APA style, you do not need everything shown in SPSS—only a few key values
1. Paired Samples Statistics Table
Start with the Paired Samples Statistics table. This is where you extract the descriptive statistics:
- Mean (M) for each condition (e.g., Pre-Test and Post-Test)
- Standard deviation (SD)
- Sample size (N)
These values help you describe your data before reporting the test results.
2. Paired Samples Test Table
Next, move to the Paired Samples Test table. This is the most important table for APA reporting. From here, extract:
- t-value
- Degrees of freedom (df)
- p-value (Sig. 2-tailed)
These values tell you whether the difference between the two conditions is statistically significant.
Important: Focus only on these relevant values. You can ignore other parts of the SPSS output, such as correlations or confidence intervals, unless specifically required.
Step-by-Step: How to Report Paired Samples T-Test Results in APA Style
To make this easier to follow, we will use the same SPSS output from the “How to Run a Paired Sample T-Test in SPSS” guide. This ensures you can directly connect each value in the output to your APA report.
Based on the example, the following outputs were obtained.
Step 1: State the Test and Purpose
Start by clearly stating what test was conducted and what you were comparing. Keep this simple and direct.
Example: A paired sample t-test was conducted to compare test scores before and after the intervention.
Step 2: Report Descriptive Statistics
Next, report the mean (M) and standard deviation (SD) for both conditions. These values come from the Paired Samples Statistics table.
From the output:
- Pre-test: M = 58.40, SD = 7.62
- Post-test: M = 63.00, SD = 6.68
Write it as: Pre-test scores (M = 58.40, SD = 7.62) were compared with post-test scores (M = 63.00, SD = 6.68).
Step 3: Report the Test Results
Now move to the Paired Samples T Test table. Extract the t-value, degrees of freedom (df), and p-value.
From the output:
- t = -10.776
- df = 9
- p < .001
Write it in APA format: There was a statistically significant difference between the two conditions, t(9) = -10.78, p < .001.
Note. Round t-values to two decimal places and report p-values correctly (e.g., p < .001, not 0.000).
Step 4: Interpret the Result
This is where many students struggle. You need to explain what the result means in plain language.
In this case:
- The result is significant (p < .001)
- Post-test scores are higher than pre-test scores
Example interpretation: This indicates that scores significantly improved after the intervention.
Always link your interpretation back to your research question or hypothesis.
Step 5: Include Effect Size (Optional but Strongly Recommended)
Effect size tells you how large the difference is, not just whether it is significant. SPSS provides Cohen’s d in the output.
From the output:
- Cohen’s d ≈ 3.41
Write it as: The effect size was large (Cohen’s d = 3.41), indicating a substantial difference between pre-test and post-test scores.
As a guide, a Cohen’s d of:
- 0.2 indicates a small effect
- 0.5 indicates a medium effect
- 0.8+indicates a large effect
Final APA Example
A paired sample t-test was conducted to compare test scores before and after the intervention. Pre-test scores (M = 58.40, SD = 7.62) were lower than post-test scores (M = 63.00, SD = 6.68). This difference was statistically significant, t(9) = -10.78, p < .001. The results suggest that the intervention led to a significant improvement in scores. The effect size was large (Cohen’s d = 3.41).
This structure makes it very easy for readers to:
- Follow along with SPSS
- Copy the format
- Avoid common APA mistakes
APA Reporting Template for Paired Samples T-Test Results
If you’re unsure how to structure your results, this simple template can save you time and help you avoid formatting mistakes. You can copy it and replace the values with your own SPSS output. This is especially useful when writing assignments or dissertations where APA accuracy matters.
Template: A paired sample t-test was conducted to compare [variable] before and after [condition]. There was a [significant/not significant] difference between [condition 1] (M = __, SD = __) and [condition 2] (M = __, SD = __); t(df) = __, p =, 95% CI [, __], d = __.
Example 1: Significant Result
Seeing a complete example makes APA reporting much easier. Below is a worked example based on a situation where the paired sample t-test shows a statistically significant difference between the two time points.
Scenario. A researcher wants to examine whether students’ scores improved after attending a revision program. The same 10 students completed a test before the program and again after the program.
From the SPSS output, the following values were obtained:
- Pre-test: M = 58.40, SD = 7.62
- Post-test: M = 63.00, SD = 6.68
- t-value: -10.78
- df: 9
- p-value: < .001
APA Example. A paired sample t-test was conducted to compare students’ test scores before and after the revision program. Pre-test scores (M = 58.40, SD = 7.62) were lower than post-test scores (M = 63.00, SD = 6.68). There was a statistically significant difference between the two scores, t(9) = -10.78, p < .001. This result means that the students performed significantly better after the revision program than they did before it. In simple terms, the intervention appears to have improved test performance.
Example 2: Non-Significant Result
It is also important to know how to report a paired sample t-test when the result is not statistically significant. Many students make the mistake of forcing an interpretation that suggests improvement or decline, even when the test shows no meaningful difference. In this case, your wording should clearly state that there was no significant difference.
Scenario. A researcher wants to test whether a short training session improved employees’ confidence scores. The same 12 employees were assessed before and after the training.
From the SPSS output, the results were:
- Before training: M = 21.50, SD = 4.10
- After training: M = 22.08, SD = 4.35
- t-value: -1.21
- df: 11
- p-value: .252
APA Example. A paired sample t-test was conducted to compare employees’ confidence scores before and after the training session. Confidence scores before training (M = 21.50, SD = 4.10) were slightly lower than confidence scores after training (M = 22.08, SD = 4.35). However, there was no statistically significant difference between the two scores, t(11) = -1.21, p = .252. This result means that although the mean score after training was a little higher, the difference was not statistically significant. In other words, the small increase in confidence could have happened by chance. Based on this test, there is not enough evidence to conclude that the training session produced a real change in confidence scores.
Note. When the result is not significant, the key phrase to use is “there was no statistically significant difference.” You should avoid wording that sounds too strong, such as saying the intervention improved outcomes, unless the statistical result supports that claim. You can still mention the direction of the means, but the conclusion must remain cautious and accurate.
Therefore, the main difference between reporting significant and non-significant results is in the interpretation. For significant results, you can state that a meaningful change occurred. For non-significant results, you should state that there was no significant difference and avoid overstating the findings.
How to Report Paired Samples T-Test Results in APA Table Format
You can also present your results in a simple APA-style table. This helps summarize the descriptive statistics clearly before reporting the test results in text.
Table 1
Paired Sample T-Test Results
| Condition | M | SD | t | df | p |
|---|---|---|---|---|---|
| Pre-test | 58.40 | 7.62 | |||
| Post-test | 63.00 | 6.68 | -10.78 | 9 | < .001 |
Common Mistakes to Avoid When Reporting a Paired Sample T-Test in APA Style
Even when students run the correct test in SPSS, they often lose marks because of reporting mistakes. APA style is not just about inserting numbers into a sentence. You also need to present the results accurately, use the correct format, and interpret the findings properly. Below are some of the most common mistakes to avoid when writing up a paired sample t-test.
Not Reporting Means and Standard Deviations
One of the most common mistakes is reporting only the t-value and p-value while leaving out the descriptive statistics. In APA style, you should report the mean and standard deviation for both conditions. This helps the reader understand the actual scores in each condition, not just whether the difference was significant. Without the means and standard deviations, your report is incomplete and less informative.
For example, instead of writing only t(9) = -10.78, p < .001, you should also include the descriptive values for the pre-test and post-test scores.
Using Incorrect APA Formatting
Formatting errors are also very common. A frequent example is writing p = 0.000, which is not correct in APA style. If SPSS shows .000, you should report it as p < .001. This is because a p-value cannot actually be zero. It is simply smaller than .001.
Other formatting issues include failing to italicize statistical symbols such as t, p, M, and SD, using too many decimal places, or writing values inconsistently. APA style usually prefers concise and consistent formatting, often with two decimal places for most statistics.
Forgetting to Report Degrees of Freedom
Another common error is reporting the t-value without the degrees of freedom. In APA style, the t statistic should be written in this format: t(df) = value. The degrees of freedom are an important part of the result because they provide context for the statistical test.
For example, the correct format is t(9) = -10.78, not just t = -10.78. Leaving out df makes the report incomplete and not fully compliant with APA style.
Misinterpreting the p-Value
Many students misunderstand what the p-value actually tells them. A p-value below .05 usually means the difference is statistically significant, while a p-value above .05 means the result is not statistically significant. However, this does not mean the intervention “failed” or that there was “no change at all.” It only means there is not enough statistical evidence to conclude that the observed difference is real rather than due to chance.
For significant results, you can say there was a statistically significant difference between the two conditions. For non-significant results, you should say there was no statistically significant difference. Be careful not to overstate what the test shows.
Ignoring the Direction of Change
Some students report that a difference was significant, but do not explain whether scores increased or decreased. This is a problem because the reader needs to know the direction of the change. A paired sample t-test compares two related means, so your write-up should make clear which condition had the higher mean.
For example, if post-test scores are higher than pre-test scores, say so directly. If scores decreased after an intervention, that should also be stated clearly. Simply saying there was a significant difference is not enough. The direction of change gives the result practical meaning.
Tip. A strong APA report should do more than list numbers. It should show the means and standard deviations, present the test statistic correctly, report the p-value in APA format, include the degrees of freedom, and clearly explain whether scores increased, decreased, or did not change significantly. Avoiding these common mistakes will make your paired sample t-test report clearer, more accurate, and more professional.
Tips to Improve Your Paired Samples T-Test Results APA Reporting
Even when you understand the steps, small mistakes in writing can reduce the quality of your APA report. The good news is that a few simple habits can make your reporting clearer, more accurate, and more professional.
- Keep sentences concise: Write short, clear sentences. Avoid unnecessary words and keep your reporting direct and easy to read.
- Report exact p-values (except when very small): Use exact values like p = .023 whenever possible. If SPSS shows .000, report it as p < .001.
- Match interpretation with your hypothesis: Make sure your conclusion reflects the results. If the result is not significant, clearly state that there is no statistically significant difference.
- Double-check your SPSS output: Always verify that your reported values (M, SD, t, df, p) are correct and taken from the right tables.
Need Help Reporting Your Paired Sample T-Test?
If you’re unsure whether your results are correct or properly formatted in APA style, it’s easy to make small mistakes that affect your grades. From choosing the right values in SPSS to writing a clear and accurate interpretation, every step matters.
At SPSSAnalysisHelp.com, we help students turn SPSS output into clean, well-written APA reports. Whether you need help checking your results, interpreting findings, or completing your entire analysis, you can get expert SPSS Analysis Help tailored to your assignment.
Get accurate results, clear explanations, and properly formatted APA reports—so you can submit your work with confidence.